\n
## Diagram: Grid-Based Maze or Puzzle Layout
### Overview
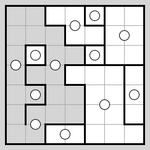
The image displays a square grid diagram, likely representing a maze, puzzle, or spatial partitioning problem. It consists of an 8x8 grid of smaller squares, with certain areas shaded in light gray and others left white. The grid contains several circular markers and is subdivided by thick black lines that form irregular, interconnected regions. There is no textual information, labels, axes, or legends present in the image.
### Components/Axes
* **Grid Structure:** An 8x8 square grid, creating 64 individual cells.
* **Shading:** Two primary shaded regions exist:
1. A large, irregular shaded region occupying much of the left and bottom-left portion of the grid.
2. A smaller, separate shaded region in the top-right corner.
* **Boundaries:** Thick black lines subdivide the entire grid into 11 distinct, non-rectangular regions or "rooms." These lines follow the grid lines but create complex shapes.
* **Markers:** There are 12 white circles (or octagons, appearing circular at this resolution) placed within various cells of the grid. Their distribution is as follows:
* **Within Shaded Regions:** 5 circles.
* **Within Unshaded (White) Regions:** 7 circles.
### Detailed Analysis
**Spatial Layout and Element Placement:**
* **Top-Left Quadrant:** Contains the start of the large shaded region. A circle is located near the top-left corner (approx. row 2, column 2 from top-left).
* **Top-Right Quadrant:** Contains the smaller, isolated shaded region. Two circles are present here: one inside the shaded area (approx. row 2, column 6) and one just outside it in a white region (approx. row 3, column 7).
* **Bottom-Left Quadrant:** This is the densest area, containing the bulk of the large shaded region and 4 circles clustered within it.
* **Bottom-Right Quadrant:** Primarily unshaded (white) and contains 3 circles.
* **Central Area:** The thick boundary lines converge near the center, creating a complex junction of multiple regions.
**Pattern of Circles:**
The circles do not follow a simple geometric pattern (like a straight line or perfect grid). They appear scattered, potentially representing points of interest, start/end points, or obstacles within the maze-like structure.
### Key Observations
1. **No Textual Data:** The image contains zero text, numbers, labels, or symbols beyond the geometric shapes described.
2. **Asymmetric Partitioning:** The black boundary lines create a highly asymmetric division of the grid. Regions vary greatly in size and shape, from small 2-cell enclosures to large, sprawling areas.
3. **Shading as a Distinguishing Feature:** The gray shading clearly differentiates two zones from the rest of the white grid. The relationship between the shaded zones and the placement of circles is not immediately obvious (circles are in both shaded and unshaded areas).
4. **Potential Function:** The diagram strongly resembles a visual puzzle, such as a "slitherlink" or "masyu" logic puzzle, a maze layout for a game, or a diagram illustrating a graph theory problem (where regions are nodes and shared boundaries are edges).
### Interpretation
This image is a purely graphical representation devoid of explicit data. Its meaning is encoded in its spatial relationships.
* **What it Demonstrates:** It presents a defined spatial environment with rules implied by its structure: movement or connection is likely constrained by the thick black boundaries. The circles act as specific nodes or targets within this environment.
* **Relationship Between Elements:** The shaded regions may denote a specific property (e.g., "filled," "active," "owned") as opposed to the unshaded regions. The circles are the primary interactive or notable elements placed within this partitioned space. The core relationship is between the **fixed topology** (the grid and its subdivisions) and the **variable placement** of the circular markers.
* **Notable Anomalies/Patterns:** The most notable feature is the complete lack of explanatory text. This suggests the diagram is either part of a larger context (e.g., a puzzle with instructions provided separately) or is an abstract representation where the viewer is meant to deduce the rules from the visual layout alone. The clustering of circles in the bottom-left shaded area versus their sparser distribution elsewhere could be a key clue to the diagram's purpose.
**Conclusion for Technical Documentation:**
This image contains no extractable textual or numerical data. It is a visual diagram of a partitioned grid with marked points. To derive factual information from it, one would need the accompanying rules, legend, or problem statement that defines what the grid, shading, boundaries, and circles represent. Without that context, the image is a geometric pattern whose informational content is purely relational and positional.