## Chart: Importance Score vs. Reasoning Step
### Overview
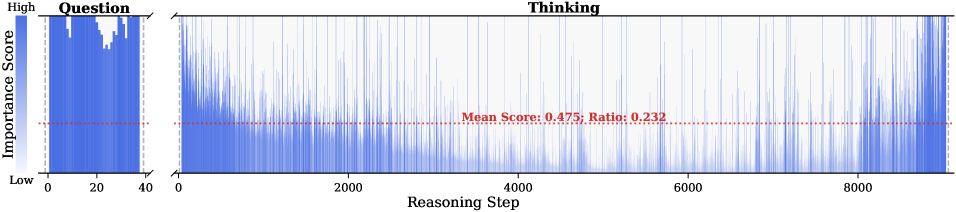
The image presents two charts side-by-side. The left chart, labeled "Question," displays the distribution of importance scores. The right chart, labeled "Thinking," shows the importance score at each reasoning step. A horizontal dotted line indicates the mean score and ratio for the "Thinking" chart.
### Components/Axes
**Left Chart ("Question"):**
* **Title:** Question
* **Y-axis:** Importance Score, ranging from "Low" at the bottom to "High" at the top.
* **X-axis:** Ranges from 0 to 40.
**Right Chart ("Thinking"):**
* **Title:** Thinking
* **Y-axis:** Implicitly Importance Score, ranging from low to high.
* **X-axis:** Reasoning Step, ranging from 0 to 9000.
* **Horizontal Line:** Represents "Mean Score: 0.475; Ratio: 0.232"
### Detailed Analysis
**Left Chart ("Question"):**
* The data is represented as vertical bars.
* The distribution appears to be bimodal, with peaks around x=10 and x=30.
* The importance scores are generally high, with most bars reaching near the "High" level on the y-axis.
**Right Chart ("Thinking"):**
* The data is represented as vertical lines.
* The importance score fluctuates significantly across the reasoning steps.
* The density of lines is higher at the beginning and end of the reasoning process.
* The mean score is 0.475, and the ratio is 0.232, as indicated by the horizontal line.
* The importance scores appear to decrease from step 0 to approximately step 2000, then fluctuate around the mean. There is an increase in importance score from step 8000 to 9000.
### Key Observations
* The "Question" chart shows a relatively high importance score for the initial question.
* The "Thinking" chart shows a fluctuating importance score during the reasoning process, with a general decrease in importance score from step 0 to approximately step 2000.
* The mean score and ratio provide a baseline for understanding the overall importance score during the reasoning process.
### Interpretation
The charts suggest that the initial question is considered important, and the importance score fluctuates during the reasoning process. The decrease in importance score from step 0 to approximately step 2000 may indicate that the model is exploring different avenues of reasoning, some of which are less relevant to the initial question. The fluctuations around the mean score suggest that the model is constantly re-evaluating the importance of different reasoning steps. The increase in importance score from step 8000 to 9000 may indicate that the model is converging on a solution. The mean score and ratio provide a quantitative measure of the overall importance score during the reasoning process.