## Heatmap/Bar Chart: Importance Score vs. Reasoning Step
### Overview
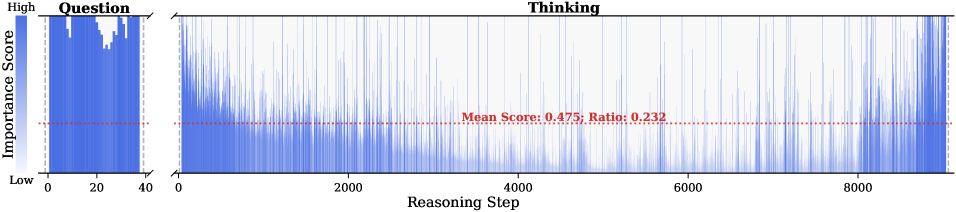
The image displays a two-part horizontal bar chart (or heatmap) visualizing the "Importance Score" of different "Reasoning Steps" across two distinct phases: "Question" and "Thinking." The chart uses a blue color gradient to represent score intensity, with a red dashed reference line indicating a mean score.
### Components/Axes
* **Y-Axis (Vertical):** Labeled **"Importance Score"**. It is a categorical scale with two marked positions: **"High"** at the top and **"Low"** at the bottom.
* **X-Axis (Horizontal):** Labeled **"Reasoning Step"**. It is a numerical scale with major tick marks at **0, 2000, 4000, 6000, and 8000**.
* **Chart Sections:** The chart is divided into two adjacent panels:
1. **Left Panel:** Titled **"Question"**. It covers the x-axis range from approximately step 0 to step 40.
2. **Right Panel:** Titled **"Thinking"**. It covers the x-axis range from step 0 to beyond step 8000.
* **Reference Line:** A horizontal red dashed line runs across both panels. It is annotated with the text: **"Mean Score: 0.475; Ratio: 0.232"**. This line is positioned at a y-value corresponding to an importance score of approximately 0.475.
* **Data Representation:** Data is represented as vertical bars (or heatmap cells) colored in shades of blue. The height (or color intensity) of each bar corresponds to its Importance Score. Darker/Fuller blue indicates a higher score.
### Detailed Analysis
**1. "Question" Panel (Steps 0-40):**
* **Trend:** This section shows a very dense, nearly continuous block of high importance scores.
* **Data Points:** From step 0 to approximately step 40, the importance scores are consistently at or near the "High" level. The blue bars fill almost the entire vertical space from "Low" to "High," indicating sustained high importance throughout this initial phase. There is a slight dip in density/score around steps 20-30.
**2. "Thinking" Panel (Steps 0-8000+):**
* **Trend:** This section shows a sparse, irregular distribution of high importance scores against a background of generally lower scores.
* **Data Points:**
* **Early Phase (Steps 0-2000):** There is a cluster of high-importance spikes at the very beginning (steps 0-500), followed by a period of relatively lower and more scattered scores.
* **Middle Phase (Steps 2000-6000):** High-importance scores appear as isolated, thin vertical lines or small clusters. Notable spikes occur around steps ~2500, ~3500, ~4500, and ~5500. The density of high scores is lower here than in the early or late phases.
* **Late Phase (Steps 6000-8000+):** The frequency and density of high-importance spikes increase significantly, particularly from step 7000 onward, culminating in a very dense cluster of high scores around and after step 8000.
**3. Reference Line & Annotation:**
* The red dashed line at **y ≈ 0.475** serves as a visual threshold. A significant portion of the data points in the "Thinking" panel fall below this line, while most of the "Question" panel data is above it.
* The annotation **"Mean Score: 0.475; Ratio: 0.232"** provides summary statistics. The "Mean Score" likely refers to the average importance score across the entire dataset. The "Ratio: 0.232" is ambiguous but could represent the proportion of steps exceeding the mean, or another derived metric.
### Key Observations
1. **Phase Dichotomy:** There is a stark contrast between the "Question" phase (short, uniformly high importance) and the "Thinking" phase (long, sporadically high importance).
2. **Temporal Clustering in "Thinking":** High-importance events in the "Thinking" phase are not random; they show clustering at the beginning and especially at the end of the process.
3. **Mean Score Threshold:** The annotated mean score (0.475) visually separates the consistently high "Question" phase from the variable "Thinking" phase.
4. **Spatial Layout:** The "Question" panel is positioned on the far left, emphasizing its role as the initiating phase. The "Thinking" panel dominates the chart area, reflecting its longer duration. The legend/annotation is placed centrally within the "Thinking" panel.
### Interpretation
This chart likely visualizes the output of an AI or cognitive model's reasoning process. The data suggests a clear two-stage architecture:
* **Stage 1 - Question Analysis:** The model dedicates intense, focused attention (high importance) to understanding the initial question or prompt. This is a short but critical phase where the problem is framed.
* **Stage 2 - Deliberative Thinking:** The model then engages in a prolonged reasoning process. Importance scores here are bursty, indicating that the model's "attention" or "confidence" spikes at specific, non-contiguous steps. These spikes likely correspond to key inferential leaps, hypothesis evaluations, or evidence integration points. The increased density of high-importance scores towards the end (steps 7000+) suggests a convergence phase where the model synthesizes information to form a conclusion.
The **"Ratio: 0.232"** is a key metric. If interpreted as the fraction of steps with importance above the mean, it indicates that only about 23.2% of the reasoning steps are considered highly important by the model's internal scoring mechanism. This highlights the efficiency of the process—most steps are background computation, with critical insights occurring at specific junctures.
**In essence, the chart maps the "cognitive effort" or "attentional focus" of a system over time, revealing a pattern of concentrated initial analysis followed by a long, punctuated deliberation leading to a conclusion.**