\n
## Line Chart: Execution Time vs. Max Region Size
### Overview
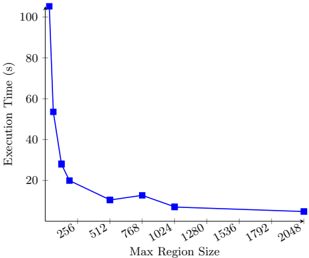
The image presents a line chart illustrating the relationship between "Max Region Size" and "Execution Time". The chart shows a steep decrease in execution time as the max region size increases, followed by a leveling off. The chart appears to be evaluating the performance of an algorithm or process as a function of the size of the regions it operates on.
### Components/Axes
* **X-axis:** "Max Region Size" with values: 256, 512, 768, 1024, 1280, 1536, 1792, 2048.
* **Y-axis:** "Execution Time (s)" with a scale ranging from 0 to 100+, incrementing by 20.
* **Data Series:** A single blue line representing the execution time.
* **No Legend:** The chart does not have a legend, but the single line is clearly associated with the relationship between the two axes.
### Detailed Analysis
The blue line starts at approximately 104 seconds at a Max Region Size of 256. The line then exhibits a steep downward trend.
* At Max Region Size 256, Execution Time is approximately 104 seconds.
* At Max Region Size 512, Execution Time is approximately 54 seconds.
* At Max Region Size 768, Execution Time is approximately 22 seconds.
* At Max Region Size 1024, Execution Time is approximately 15 seconds.
* At Max Region Size 1280, Execution Time is approximately 12 seconds.
* At Max Region Size 1536, Execution Time is approximately 11 seconds.
* At Max Region Size 1792, Execution Time is approximately 10 seconds.
* At Max Region Size 2048, Execution Time is approximately 9 seconds.
The trend is a rapid decrease in execution time from a Max Region Size of 256 to 1024, after which the decrease slows significantly, approaching a plateau around 9-12 seconds.
### Key Observations
The most significant observation is the dramatic reduction in execution time as the Max Region Size increases from 256 to 1024. Beyond 1024, the gains in performance become marginal. This suggests that there is a threshold for the Max Region Size beyond which increasing it further does not yield substantial improvements in execution time.
### Interpretation
The data suggests that the algorithm or process being evaluated benefits significantly from larger region sizes, up to a certain point. This could be due to factors such as reduced overhead, improved data locality, or better utilization of parallel processing capabilities. The leveling off of the curve beyond a Max Region Size of 1024 indicates that the benefits of increasing the region size are diminishing, potentially due to other limiting factors such as memory constraints or the inherent complexity of the algorithm. The optimal Max Region Size appears to be around 1024, as it provides a good balance between execution time and potential overhead. This chart is likely demonstrating the impact of block size or chunk size on the performance of a data processing algorithm.