## Chart: Exact Match vs. SFT Data Ratio
### Overview
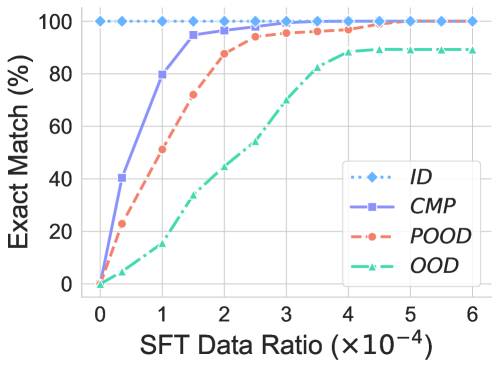
The image presents a line chart illustrating the relationship between the SFT (Supervised Fine-Tuning) Data Ratio and the Exact Match percentage for four different models/metrics: ID, CMP, POOD, and OOD. The chart demonstrates how the performance (Exact Match) of each model improves as the amount of SFT data increases.
### Components/Axes
* **X-axis:** SFT Data Ratio (×10⁻⁴). Scale ranges from approximately 0 to 6.
* **Y-axis:** Exact Match (%). Scale ranges from 0 to 100.
* **Legend:** Located in the top-right corner. Contains the following labels and corresponding colors:
* ID (Blue, dotted line)
* CMP (Purple, solid line)
* POOD (Orange, dashed line)
* OOD (Teal, dash-dot line)
* **Gridlines:** Present to aid in reading values.
### Detailed Analysis
* **ID (Blue, dotted):** The line starts at approximately 100% Exact Match at an SFT Data Ratio of 0. It remains relatively stable at around 100% throughout the entire range of SFT Data Ratios.
* (0, 100)
* (1, 100)
* (2, 100)
* (3, 100)
* (4, 100)
* (5, 100)
* (6, 100)
* **CMP (Purple, solid):** The line begins at approximately 40% Exact Match at an SFT Data Ratio of 0. It rapidly increases to approximately 95% at an SFT Data Ratio of 1. It plateaus around 95-98% for the remainder of the SFT Data Ratio range.
* (0, 40)
* (1, 95)
* (2, 98)
* (3, 98)
* (4, 98)
* (5, 98)
* (6, 98)
* **POOD (Orange, dashed):** The line starts at approximately 0% Exact Match at an SFT Data Ratio of 0. It increases sharply to approximately 85% at an SFT Data Ratio of 2. It continues to increase, but at a slower rate, reaching approximately 95% at an SFT Data Ratio of 6.
* (0, 0)
* (1, 40)
* (2, 85)
* (3, 90)
* (4, 93)
* (5, 95)
* (6, 95)
* **OOD (Teal, dash-dot):** The line begins at approximately 0% Exact Match at an SFT Data Ratio of 0. It steadily increases, reaching approximately 75% at an SFT Data Ratio of 6. This line exhibits the slowest rate of increase among the four models.
* (0, 0)
* (1, 15)
* (2, 40)
* (3, 60)
* (4, 75)
* (5, 80)
* (6, 85)
### Key Observations
* The ID model consistently achieves 100% Exact Match regardless of the SFT Data Ratio.
* CMP demonstrates the fastest improvement in Exact Match with increasing SFT Data Ratio, reaching a plateau quickly.
* POOD and OOD show a more gradual improvement, with POOD outperforming OOD across all SFT Data Ratios.
* OOD requires the most SFT data to achieve a reasonable level of Exact Match.
### Interpretation
The chart suggests that increasing the amount of SFT data generally improves the performance of the models, as measured by Exact Match. However, the extent of improvement varies significantly between models. The ID model appears to be already highly optimized or inherently capable of achieving perfect matches, while CMP benefits the most from SFT. POOD and OOD show a more moderate improvement, indicating they may require more data or different optimization strategies to reach the same level of performance as ID and CMP. The differences in performance between the models could be due to variations in their architectures, training data, or the specific tasks they are designed to perform. The chart highlights the importance of SFT in enhancing model accuracy and the potential for diminishing returns as the SFT Data Ratio increases. The fact that ID remains at 100% suggests it may be a baseline or a model that has already reached its maximum potential.