## Histogram: Question vs. Answer Token Distribution
### Overview
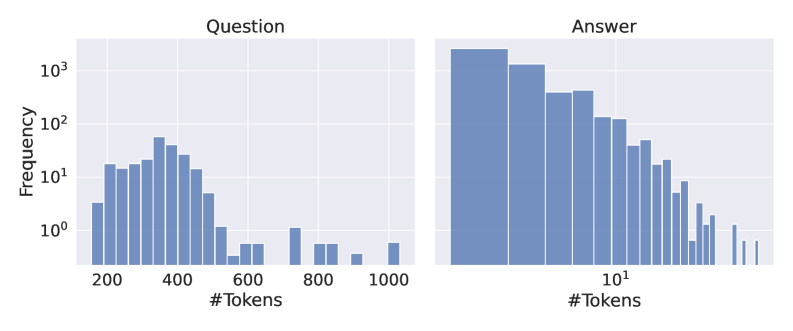
The image presents two histograms side-by-side, comparing the distribution of the number of tokens in "Question" and "Answer" texts. The y-axis (Frequency) is on a logarithmic scale, while the x-axis represents the number of tokens.
### Components/Axes
* **Titles:** "Question" (left histogram), "Answer" (right histogram)
* **Y-axis:** "Frequency" (logarithmic scale) with markers at 10<sup>0</sup>, 10<sup>1</sup>, 10<sup>2</sup>, and 10<sup>3</sup>.
* **X-axis (Question):** "#Tokens" with markers at 200, 400, 600, 800, and 1000.
* **X-axis (Answer):** "#Tokens" (logarithmic scale) with a marker at 10<sup>1</sup>.
### Detailed Analysis
**Question Histogram:**
* The distribution is unimodal and skewed to the right.
* The frequency is highest between 300 and 400 tokens.
* The frequency decreases as the number of tokens increases beyond 400.
* Approximate Frequencies:
* 200 tokens: ~15
* 300 tokens: ~30
* 400 tokens: ~25
* 500 tokens: ~10
* 600 tokens: ~2
* 700 tokens: ~2
* 800 tokens: ~2
* 900 tokens: ~1
* 1000 tokens: ~1
**Answer Histogram:**
* The distribution is heavily skewed to the right.
* The frequency is highest for very small number of tokens.
* The frequency decreases rapidly as the number of tokens increases.
* Approximate Frequencies:
* 1 token: ~1500
* 2 tokens: ~1000
* 3 tokens: ~600
* 4 tokens: ~400
* 5 tokens: ~300
* 6 tokens: ~200
* 7 tokens: ~150
* 8 tokens: ~100
* 9 tokens: ~70
* 10 tokens: ~50
* 15 tokens: ~20
* 20 tokens: ~10
* 30 tokens: ~3
* 40 tokens: ~1
### Key Observations
* Questions tend to have a higher number of tokens compared to answers.
* The distribution of tokens in questions is more uniform than in answers.
* Answers are heavily concentrated at very low token counts.
### Interpretation
The histograms suggest that the "Answer" texts are significantly shorter than the "Question" texts. The logarithmic scale on both the y-axis (Frequency) and the x-axis (Answer #Tokens) highlights the vast difference in the number of tokens between questions and answers. The data implies that the answers are concise, while the questions are more detailed and descriptive. The shape of the "Question" histogram indicates a typical length for questions, while the "Answer" histogram shows a strong preference for very short answers.