\n
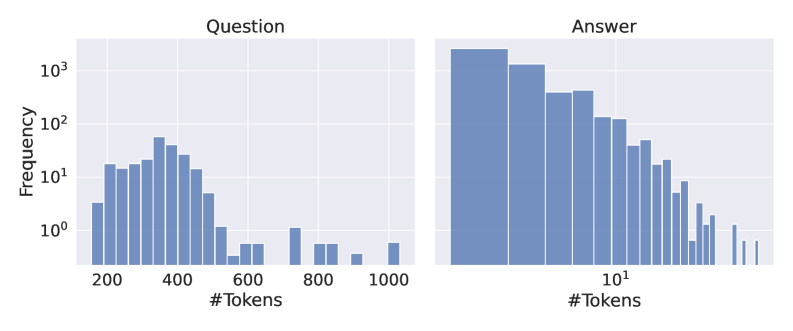
## Histograms: Token Distribution for Questions and Answers
### Overview
The image presents two histograms displayed side-by-side. The left histogram represents the distribution of token counts for "Question" data, and the right histogram represents the distribution of token counts for "Answer" data. Both histograms use a logarithmic scale on the y-axis (Frequency). The x-axis represents the number of tokens.
### Components/Axes
* **X-axis (Both Histograms):** "# Tokens" - Represents the number of tokens. The scale is logarithmic, ranging from approximately 10^2 (100) to 10^3 (1000) for the "Question" histogram and from approximately 10^0 (1) to 10^2 (100) for the "Answer" histogram.
* **Y-axis (Both Histograms):** "Frequency" - Represents the number of occurrences of a given token count. The scale is logarithmic, ranging from approximately 10^0 (1) to 10^3 (1000).
* **Title (Left Histogram):** "Question"
* **Title (Right Histogram):** "Answer"
* **No Legend:** No legend is present.
### Detailed Analysis or Content Details
**Question Histogram (Left):**
The histogram shows a roughly normal distribution, but skewed slightly to the right. The peak frequency occurs around 300-400 tokens.
* Frequency at approximately 200 tokens: ~10^1 (10)
* Frequency at approximately 300 tokens: ~10^2 (100)
* Frequency at approximately 400 tokens: ~80
* Frequency at approximately 500 tokens: ~10
* Frequency at approximately 600 tokens: ~2
* Frequency at approximately 800 tokens: ~1
* Frequency at approximately 1000 tokens: ~0.5
**Answer Histogram (Right):**
The histogram shows a distribution that is skewed to the right, with a peak at lower token counts. The peak frequency occurs around 10-20 tokens.
* Frequency at approximately 10 tokens: ~10^3 (1000)
* Frequency at approximately 20 tokens: ~500
* Frequency at approximately 30 tokens: ~300
* Frequency at approximately 40 tokens: ~200
* Frequency at approximately 50 tokens: ~100
* Frequency at approximately 60 tokens: ~50
* Frequency at approximately 80 tokens: ~20
* Frequency at approximately 100 tokens: ~5
### Key Observations
* The "Question" histogram has a higher average token count than the "Answer" histogram.
* The "Answer" histogram is more heavily concentrated at lower token counts.
* Both distributions are not perfectly symmetrical, indicating some skewness.
* The logarithmic scale on the y-axis emphasizes the differences in frequency at lower token counts.
### Interpretation
The data suggests that questions, on average, are significantly longer than answers in terms of token count. This is a common characteristic in question-answering datasets, where questions often require more context and detail than the corresponding answers. The right skewness in both distributions indicates that there are some questions and answers that are much longer than the typical length. The logarithmic scale highlights the prevalence of shorter answers, while still allowing us to see the distribution of longer questions. This information could be useful for optimizing models for question answering, such as setting appropriate maximum sequence lengths or using different architectures for processing questions and answers. The difference in distributions could also reflect the nature of the questions and answers themselves – perhaps questions are more open-ended and require more explanation, while answers are concise and direct.