\n
## Chart: Accuracy vs. N for Different Models
### Overview
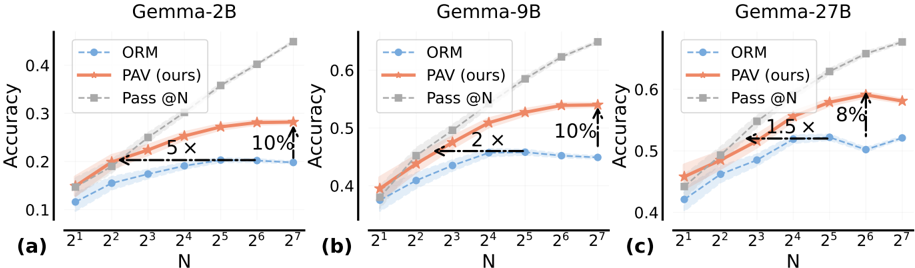
This image presents three line charts, each comparing the accuracy of three methods – ORM, PAV (ours), and Pass@N – across varying values of N. Each chart corresponds to a different model: Gemma-2B, Gemma-9B, and Gemma-27B. The charts visualize how accuracy changes as N (likely representing the number of samples or attempts) increases. Shaded areas around each line represent confidence intervals.
### Components/Axes
* **X-axis:** Labeled "N", with tick marks at 2<sup>1</sup>, 2<sup>2</sup>, 2<sup>3</sup>, 2<sup>4</sup>, 2<sup>5</sup>, 2<sup>6</sup>, and 2<sup>7</sup>.
* **Y-axis:** Labeled "Accuracy", with a scale ranging from approximately 0.1 to 0.65.
* **Legend:** Located at the top-left of each chart, containing the labels:
* ORM (Blue line with circle markers)
* PAV (ours) (Orange line with circle markers)
* Pass@N (Gray dashed line with diamond markers)
* **Chart Titles:**
* (a) Gemma-2B
* (b) Gemma-9B
* (c) Gemma-27B
* **Annotations:** Each chart includes arrows indicating percentage improvements of PAV (ours) over ORM.
### Detailed Analysis or Content Details
**Gemma-2B (Chart a):**
* **ORM (Blue):** Starts at approximately 0.17 accuracy at N=2<sup>1</sup>, rises to around 0.24 at N=2<sup>3</sup>, plateaus around 0.25-0.27 for N=2<sup>4</sup> through N=2<sup>7</sup>.
* **PAV (Orange):** Starts at approximately 0.21 accuracy at N=2<sup>1</sup>, steadily increases to around 0.33 at N=2<sup>7</sup>.
* **Pass@N (Gray):** Starts at approximately 0.23 accuracy at N=2<sup>1</sup>, and increases steadily to approximately 0.41 at N=2<sup>7</sup>.
* **Annotation:** An arrow indicates a 5x improvement of PAV over ORM at N=2<sup>3</sup>, and a 10% improvement at N=2<sup>7</sup>.
**Gemma-9B (Chart b):**
* **ORM (Blue):** Starts at approximately 0.32 accuracy at N=2<sup>1</sup>, rises to around 0.38 at N=2<sup>3</sup>, plateaus around 0.38-0.42 for N=2<sup>4</sup> through N=2<sup>7</sup>.
* **PAV (Orange):** Starts at approximately 0.40 accuracy at N=2<sup>1</sup>, steadily increases to around 0.56 at N=2<sup>7</sup>.
* **Pass@N (Gray):** Starts at approximately 0.42 accuracy at N=2<sup>1</sup>, and increases steadily to approximately 0.62 at N=2<sup>7</sup>.
* **Annotation:** An arrow indicates a 2x improvement of PAV over ORM at N=2<sup>3</sup>, and a 10% improvement at N=2<sup>7</sup>.
**Gemma-27B (Chart c):**
* **ORM (Blue):** Starts at approximately 0.38 accuracy at N=2<sup>1</sup>, rises to around 0.45 at N=2<sup>3</sup>, then decreases slightly to around 0.43 at N=2<sup>7</sup>.
* **PAV (Orange):** Starts at approximately 0.48 accuracy at N=2<sup>1</sup>, steadily increases to around 0.61 at N=2<sup>7</sup>.
* **Pass@N (Gray):** Starts at approximately 0.50 accuracy at N=2<sup>1</sup>, and increases steadily to approximately 0.64 at N=2<sup>7</sup>.
* **Annotation:** An arrow indicates a 1.5x improvement of PAV over ORM at N=2<sup>3</sup>, and an 8% improvement at N=2<sup>7</sup>.
### Key Observations
* **PAV consistently outperforms ORM** across all models and values of N.
* **Pass@N generally achieves the highest accuracy** across all models and values of N.
* The improvement of PAV over ORM appears to diminish as N increases, particularly for Gemma-27B.
* The accuracy of ORM for Gemma-27B decreases slightly after N=2<sup>3</sup>, while PAV and Pass@N continue to improve.
### Interpretation
The charts demonstrate the effectiveness of the "PAV (ours)" method in improving accuracy compared to "ORM" across different model sizes (Gemma-2B, Gemma-9B, and Gemma-27B). The "Pass@N" method consistently achieves the highest accuracy, suggesting it is the most robust approach. The annotations highlight the percentage improvements of PAV over ORM, providing a quantifiable measure of its benefit.
The diminishing improvement of PAV over ORM as N increases suggests that the benefits of PAV are more pronounced at lower values of N. The slight decrease in ORM accuracy for Gemma-27B at higher N values could indicate overfitting or a limitation of the ORM method with larger models.
The consistent upward trend of Pass@N suggests that increasing the number of samples (N) generally leads to higher accuracy, regardless of the model size. This is expected, as more samples provide more information for the model to learn from. The differences in accuracy between the models suggest that model size plays a significant role in performance. Gemma-27B generally exhibits higher accuracy than Gemma-9B and Gemma-2B, indicating that larger models have a greater capacity to learn and generalize.