## Network Diagrams: Comparison of Two Network Configurations
### Overview
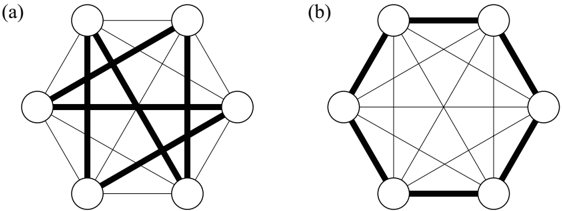
The image presents two network diagrams, labeled (a) and (b), each consisting of six nodes arranged in a hexagonal configuration. The diagrams illustrate different connection patterns between these nodes, with some connections emphasized by thicker lines.
### Components/Axes
* **Nodes:** Six nodes represented as white circles, arranged in a hexagonal shape in both diagrams.
* **Edges:** Lines connecting the nodes, representing relationships or connections. Some edges are thin, while others are thick, indicating a distinction in the type or strength of the connection.
* **Labels:**
* **(a):** Located in the top-left corner of the left diagram.
* **(b):** Located in the top-left corner of the right diagram.
### Detailed Analysis
**Diagram (a):**
* **Thick Edges:**
* A thick edge connects the top-left node to the bottom-left node.
* A thick edge connects the top-left node to the center node.
* A thick edge connects the top-right node to the bottom-right node.
* A thick edge connects the bottom-left node to the center node.
* A thick edge connects the bottom-right node to the center node.
* **Thin Edges:** All other possible connections between the nodes are represented by thin lines.
**Diagram (b):**
* **Thick Edges:**
* The six nodes are connected by thick edges, forming a hexagon.
* **Thin Edges:** All possible diagonal connections between the nodes are represented by thin lines.
### Key Observations
* Diagram (a) shows a more clustered connection pattern, with a central node having multiple thick connections.
* Diagram (b) shows a more uniform connection pattern, with all nodes having a thick connection to their immediate neighbors in the hexagon.
### Interpretation
The diagrams likely represent different network topologies or configurations. Diagram (a) could represent a network with a central hub, while diagram (b) could represent a more distributed or ring-like network. The thickness of the edges could indicate the strength or importance of the connection. The diagrams could be used to compare the properties of these different network configurations, such as their resilience to node failure or their efficiency in transmitting information.