## Line Chart: On-Policy GRPO using $\pi_k$
### Overview
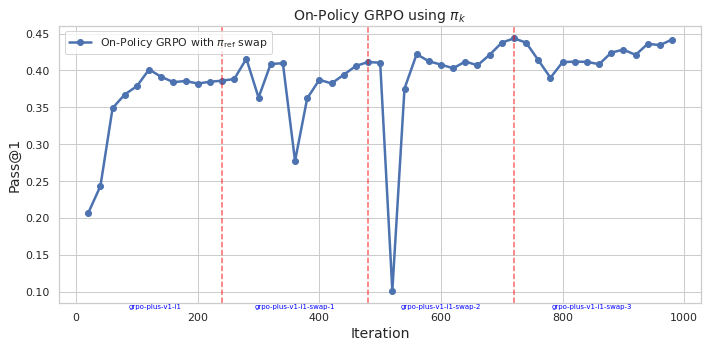
This image displays a line chart tracking the performance of an "On-Policy GRPO" (Group Relative Policy Optimization) model over 1,000 training iterations. The Y-axis measures "Pass@1" accuracy, while the X-axis represents the training "Iteration." The chart includes a single data series, vertical reference markers, and specific text labels indicating different training phases or policy swaps.
### Components/Axes
* **Title:** "On-Policy GRPO using $\pi_k$" (centered at the top).
* **Y-Axis:** Labeled "Pass@1," with a numerical scale ranging from 0.10 to 0.45 in increments of 0.05.
* **X-Axis:** Labeled "Iteration," with a numerical scale ranging from 0 to 1000 in increments of 200.
* **Legend:** Located in the top-left corner. It contains a single entry: "On-Policy GRPO with $\pi_{ref}$ swap," represented by a blue line with circular markers.
* **Vertical Markers:** Three dashed red vertical lines are positioned at approximately x=250, x=500, and x=720.
* **Bottom Annotations:** Four text labels are positioned along the bottom of the chart area:
* "grpo-plus-v1-l1" (positioned near x=100)
* "grpo-plus-v1-l1-swap-1" (positioned near x=350)
* "grpo-plus-v1-l1-swap-2" (positioned near x=550)
* "grpo-plus-v1-l1-swap-3" (positioned near x=800)
### Detailed Analysis
The data series is a blue line with circular markers. The overall trend is an upward trajectory in performance, characterized by rapid initial learning, followed by a plateau with intermittent, sharp volatility.
**Visual Trend and Data Points:**
1. **Initial Phase (0 to 120 iterations):** The line slopes sharply upward from a starting point of approximately (x=30, y=0.21) to a local peak of (x=120, y=0.40).
2. **First Plateau (120 to 300 iterations):** The performance stabilizes, fluctuating slightly between 0.38 and 0.39.
3. **First Volatility (300 to 400 iterations):** There is a sharp drop at x=360 to approximately y=0.28, followed by a rapid recovery back to y=0.41 by x=380.
4. **Second Plateau (400 to 500 iterations):** The performance remains steady around 0.41.
5. **Major Anomaly (500 to 550 iterations):** Immediately following the second red vertical line (x=500), there is a catastrophic drop in performance to y=0.10 at x=520. This is followed by an immediate, steep recovery back to y=0.37 by x=540 and y=0.42 by x=560.
6. **Final Phase (560 to 1000 iterations):** The performance stabilizes again, fluctuating between 0.40 and 0.44. The peak performance of approximately y=0.44 is reached at x=720 (coinciding with the third red vertical line) and is maintained through the end of the chart at x=980.
### Key Observations
* **Instability Events:** The chart shows two significant, sudden drops in performance (at x=360 and x=520). The drop at x=520 is particularly severe, reducing performance to the baseline level.
* **Rapid Recovery:** In both instances of performance drops, the model recovers to its previous performance level within 20–40 iterations, suggesting high resilience or rapid re-learning.
* **Correlation with Swaps:** The vertical red lines appear to mark specific "swap" events. The third red line (x=720) correlates with the model reaching its highest sustained performance level (0.44).
### Interpretation
The data demonstrates the training dynamics of a GRPO model utilizing a reference policy ($\pi_{ref}$) swap mechanism.
* **Policy Swap Impact:** The "swap" events (indicated by the red lines and the "swap-X" labels) appear to be intended to improve the model's performance. While the swap at x=720 seems to have successfully pushed the model to its peak performance, the event around x=500 (associated with "swap-2") caused a massive, temporary collapse in performance.
* **Training Stability:** The sharp, V-shaped drops suggest that updating the reference policy ($\pi_{ref}$) can introduce significant instability into the training process. The model's ability to recover quickly from these drops indicates that the underlying optimization process is robust, even if the policy updates themselves are disruptive.
* **Conclusion:** The model exhibits a "learning-forgetting-relearning" pattern common in reinforcement learning when the target distribution or reference policy is shifted. The strategy appears effective overall, as the final performance (0.44) is higher than the initial performance (0.21), despite the volatility.