## Line Chart: Exact Match (%) vs. SFT Data Ratio
### Overview
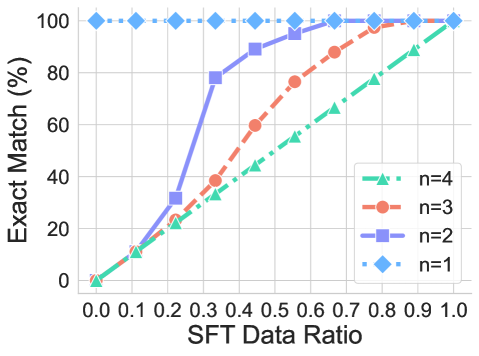
This line chart illustrates the relationship between the SFT (Supervised Fine-Tuning) Data Ratio and the Exact Match percentage, for different values of 'n'. The chart displays four lines, each representing a different value of 'n' (1, 2, 3, and 4). The x-axis represents the SFT Data Ratio, ranging from 0.0 to 1.0, while the y-axis represents the Exact Match percentage, ranging from 0% to 100%.
### Components/Axes
* **X-axis Title:** SFT Data Ratio
* **Y-axis Title:** Exact Match (%)
* **X-axis Markers:** 0.0, 0.1, 0.2, 0.3, 0.4, 0.5, 0.6, 0.7, 0.8, 0.9, 1.0
* **Y-axis Markers:** 0, 20, 40, 60, 80, 100
* **Legend:** Located in the top-right corner of the chart.
* n=4 (Green Triangle)
* n=3 (Red Circle)
* n=2 (Purple Square)
* n=1 (Blue Diamond)
### Detailed Analysis
* **n=1 (Blue Diamond):** The line starts at approximately (0.0, 100%) and remains relatively flat at 100% until approximately SFT Data Ratio of 0.8, where it begins to slightly decrease to approximately 98% at 1.0.
* **n=2 (Purple Square):** The line starts at approximately (0.0, 98%) and increases rapidly between SFT Data Ratio 0.2 and 0.4, reaching approximately 85% at 0.3 and 95% at 0.4. It then plateaus around 98-100% for the remainder of the range.
* **n=3 (Red Circle):** The line starts at approximately (0.0, 15%) and increases steadily, reaching approximately 40% at 0.3, 80% at 0.5, 90% at 0.6, 95% at 0.7, and plateaus around 98% for the remainder of the range.
* **n=4 (Green Triangle):** The line starts at approximately (0.0, 5%) and increases gradually, reaching approximately 30% at 0.3, 60% at 0.5, 80% at 0.7, 90% at 0.8, and 95% at 0.9. It reaches approximately 98% at 1.0.
### Key Observations
* Higher values of 'n' generally result in higher Exact Match percentages, especially at lower SFT Data Ratios.
* The lines converge towards 100% as the SFT Data Ratio increases, indicating that all values of 'n' achieve high Exact Match percentages with sufficient SFT data.
* n=1 consistently maintains a very high Exact Match percentage across all SFT Data Ratios.
* n=4 shows the slowest initial increase in Exact Match percentage, requiring a higher SFT Data Ratio to achieve comparable results to other values of 'n'.
### Interpretation
The data suggests that increasing the SFT Data Ratio improves the Exact Match percentage, and that the value of 'n' influences the rate of improvement. The parameter 'n' likely represents the number of samples or iterations used in the supervised fine-tuning process. The chart demonstrates a diminishing return effect: while increasing the SFT Data Ratio always helps, the benefit is smaller at higher ratios. The consistent high performance of n=1 suggests that even a small amount of supervised fine-tuning can be highly effective, especially when combined with a sufficient SFT Data Ratio. The convergence of the lines at higher SFT Data Ratios indicates that the impact of 'n' becomes less significant as more supervised data is available. This could be due to the model reaching a saturation point where additional fine-tuning provides minimal improvement. The initial lower performance of n=4 suggests that more iterations or samples may be needed initially to achieve comparable results, but it eventually catches up with other values of 'n' as the SFT Data Ratio increases.