## Diagram: Relevance Proof Propagation
### Overview
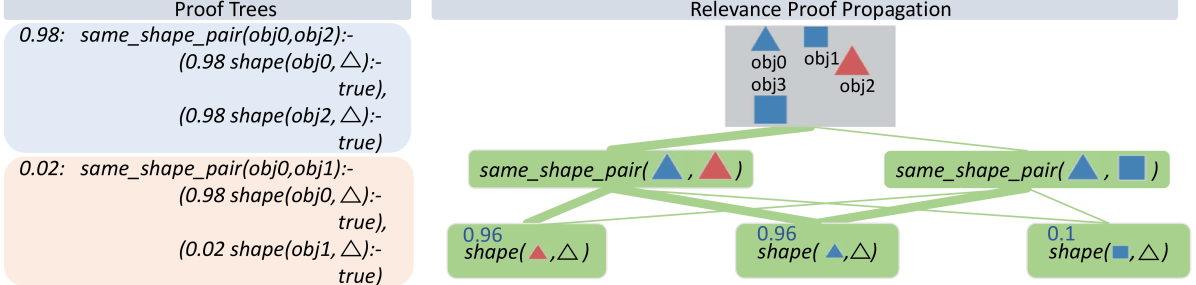
The image presents a diagram illustrating relevance proof propagation, alongside proof trees. It shows how the system determines the similarity of shapes between objects, using a tree-like structure to represent the propagation of evidence.
### Components/Axes
* **Titles:**
* "Proof Trees" (top-left)
* "Relevance Proof Propagation" (top-right)
* **Objects:**
* obj0 (blue triangle)
* obj1 (blue square)
* obj2 (red triangle)
* obj3 (blue square)
* **Nodes:** The diagram uses rounded rectangles to represent nodes, with text indicating the function or relationship being evaluated.
* **Edges:** Green lines connect the nodes, indicating the flow of information or relevance. The thickness of the lines varies, suggesting different levels of relevance or confidence.
* **Shapes:** Triangle (△), Square (□)
### Detailed Analysis
**1. Proof Trees (Left Side):**
* **Top Tree (Blue Background):**
* Confidence: 0.98
* Function: `same_shape_pair(obj0, obj2)`
* Sub-functions:
* `(0.98 shape(obj0, △):- true)`
* `(0.98 shape(obj2, △):- true)`
* **Bottom Tree (Orange Background):**
* Confidence: 0.02
* Function: `same_shape_pair(obj0, obj1)`
* Sub-functions:
* `(0.98 shape(obj0, △):- true)`
* `(0.02 shape(obj1, △):- true)`
**2. Relevance Proof Propagation (Right Side):**
* **Top Section (Gray Background):**
* Contains shapes representing objects:
* obj0: Blue Triangle
* obj1: Blue Square
* obj2: Red Triangle
* obj3: Blue Square
* **Middle Layer:**
* Node 1: `same_shape_pair(△, △)` (connected to obj0 and obj2)
* Node 2: `same_shape_pair(△, □)` (connected to obj0 and obj1)
* **Bottom Layer:**
* Node 1: `0.96 shape(△, △)` (connected to `same_shape_pair(△, △)`)
* Node 2: `0.96 shape(△, △)` (connected to `same_shape_pair(△, △)`)
* Node 3: `0.1 shape(□, △)` (connected to `same_shape_pair(△, □)`)
**3. Edge Connections:**
* The green lines connect the objects in the gray box to the `same_shape_pair` nodes.
* The `same_shape_pair` nodes are connected to the `shape` nodes in the bottom layer.
* The thickness of the lines varies, indicating the strength of the relationship or relevance.
### Key Observations
* The proof trees on the left provide the logical rules and confidence scores for determining shape similarity.
* The relevance proof propagation diagram on the right visually represents how these rules are applied to specific objects.
* The confidence scores (0.98, 0.02, 0.96, 0.1) indicate the certainty of the shape relationships.
* The varying thickness of the lines suggests different levels of relevance or confidence in the connections.
### Interpretation
The diagram illustrates a system for determining the relevance of shape relationships between objects. The proof trees define the rules and confidence scores, while the relevance proof propagation diagram shows how these rules are applied to specific objects. The system appears to be evaluating whether objects have the same shape (triangle or square) and assigning a confidence score to each relationship. The higher the confidence score, the more likely the objects are to have the same shape. The varying thickness of the lines suggests that some relationships are more relevant or have a higher degree of confidence than others. The diagram highlights the process of reasoning and evidence propagation in determining object similarity.