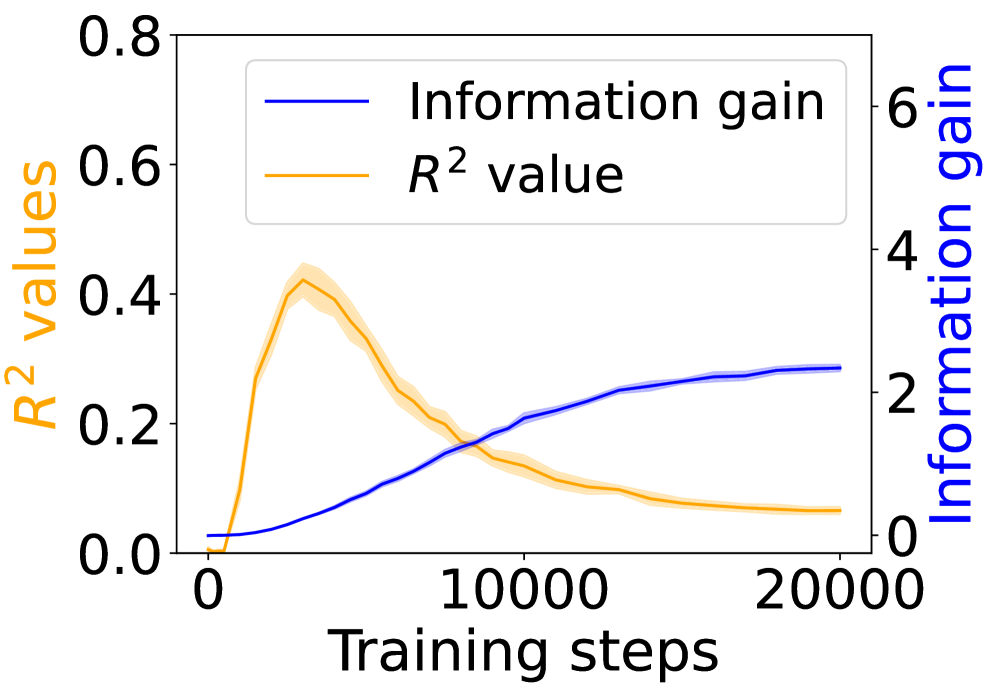
## Chart: Information Gain and R² Value vs. Training Steps
### Overview
The image is a line chart showing the relationship between training steps and two metrics: Information gain and R² value. The x-axis represents training steps, while the left y-axis represents R² values and the right y-axis represents information gain. The chart displays how these metrics change as the training progresses.
### Components/Axes
* **X-axis:** Training steps, ranging from 0 to 20000.
* **Left Y-axis:** R² values, ranging from 0.0 to 0.8, labeled in orange.
* **Right Y-axis:** Information gain, ranging from 0 to 6, labeled in blue.
* **Legend:** Located at the top-center of the chart.
* Blue line: Information gain
* Orange line: R² value
### Detailed Analysis
* **Information Gain (Blue Line):**
* Trend: Generally increasing with training steps.
* Starts at approximately 0 at 0 training steps.
* Increases to approximately 2 at 10000 training steps.
* Reaches approximately 2.5-3 at 20000 training steps.
* The area around the blue line is shaded in a lighter blue, indicating a confidence interval or standard deviation.
* **R² Value (Orange Line):**
* Trend: Initially increases, then decreases with training steps.
* Starts at approximately 0 at 0 training steps.
* Peaks at approximately 0.4-0.45 around 3000-4000 training steps.
* Decreases to approximately 0.1 at 20000 training steps.
* The area around the orange line is shaded in a lighter orange, indicating a confidence interval or standard deviation.
### Key Observations
* The R² value peaks early in training and then declines, suggesting that the model initially fits the data well but later overfits or loses its initial accuracy.
* The information gain increases steadily with training steps, indicating that the model continues to learn and extract relevant information from the data.
* There is an inverse relationship between the R² value and information gain after approximately 5000 training steps.
### Interpretation
The chart illustrates the trade-off between model fit (R² value) and information extraction (information gain) during training. The initial rise in R² suggests that the model quickly learns to fit the training data. However, as training continues, the R² value decreases, possibly due to overfitting or the model adapting to noise in the data. Simultaneously, the information gain continues to increase, indicating that the model is still learning relevant features, even as its overall fit to the data declines. This suggests that the model may be becoming more specialized or robust, even if it is no longer perfectly aligned with the initial training data distribution. The shaded regions around the lines indicate the variability or uncertainty in these metrics, providing a sense of the robustness of these trends.