## Dual-Axis Line Chart: Training Progress Metrics
### Overview
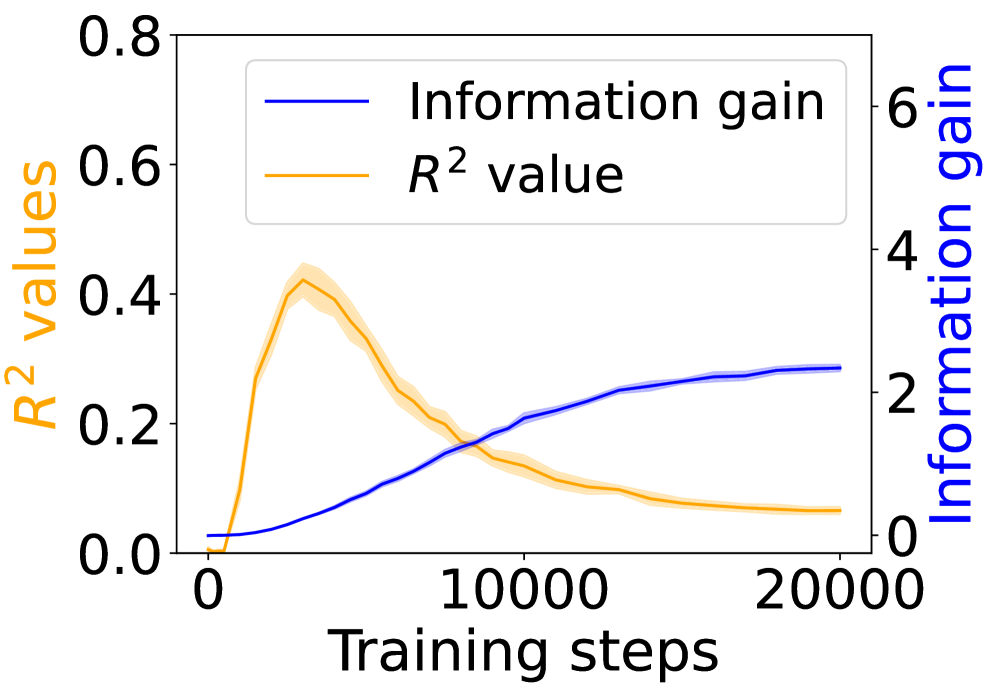
The image displays a dual-axis line chart plotting two different metrics against the number of training steps. The chart illustrates the relationship and contrasting trends between a model's "R² value" (a measure of goodness-of-fit) and its "Information gain" over the course of training.
### Components/Axes
* **X-Axis (Bottom):** Labeled **"Training steps"**. It has major tick marks and labels at **0**, **10000**, and **20000**. The axis spans from 0 to slightly beyond 20,000 steps.
* **Primary Y-Axis (Left):** Labeled **"R² values"** in orange text. The scale ranges from **0.0** to **0.8**, with major ticks at 0.0, 0.2, 0.4, 0.6, and 0.8.
* **Secondary Y-Axis (Right):** Labeled **"Information gain"** in blue text. The scale ranges from **0** to **6**, with major ticks at 0, 2, 4, and 6.
* **Legend:** Positioned in the **top-center** of the chart area. It contains two entries:
* A blue line labeled **"Information gain"**.
* An orange line labeled **"$R^2$ value"**.
* **Data Series:**
1. **Blue Line ("Information gain"):** A solid blue line with a light blue shaded region around it, indicating a confidence interval or standard deviation.
2. **Orange Line ("$R^2$ value"):** A solid orange line with a light orange shaded region around it.
### Detailed Analysis
**Trend Verification & Data Points:**
* **Information Gain (Blue Line, Right Axis):**
* **Trend:** The line shows a steady, monotonic increase that begins to plateau. It starts near 0, rises with a decreasing slope, and approaches an asymptote.
* **Approximate Data Points:**
* Step 0: ~0.1
* Step 2500: ~0.5
* Step 5000: ~1.0
* Step 7500: ~1.5
* Step 10000: ~2.0
* Step 15000: ~2.3
* Step 20000: ~2.5 (The line appears to level off around this value).
* **R² Value (Orange Line, Left Axis):**
* **Trend:** The line exhibits a sharp initial increase to a peak, followed by a gradual, sustained decline. This creates an inverted "V" or a peak-and-decay shape.
* **Approximate Data Points:**
* Step 0: ~0.0
* Step ~2500 (Peak): ~0.42. The shaded region suggests a range of approximately 0.38 to 0.46 at the peak.
* Step 5000: ~0.35
* Step 7500: ~0.25
* Step 10000: ~0.15
* Step 15000: ~0.10
* Step 20000: ~0.08
**Spatial Grounding & Key Intersection:**
* The two lines intersect at approximately **8,000 training steps**. At this point, the R² value is ~0.20 and the Information gain is ~1.7.
* The peak of the R² value occurs in the **left third** of the chart's horizontal span.
* The legend is placed in the **upper central region**, overlapping the area where the blue line is rising and the orange line is descending.
### Key Observations
1. **Inverse Relationship Post-Peak:** After the R² value peaks around 2,500 steps, the two metrics demonstrate an inverse relationship. As training continues, Information gain increases while R² value decreases.
2. **Differing Convergence:** The Information gain appears to converge to a stable, high value (~2.5), suggesting the model continues to extract useful information. The R² value converges to a low, stable value (~0.08), suggesting the model's predictive fit on the measured dataset degrades.
3. **Uncertainty Bands:** The shaded confidence intervals are widest for the R² value around its peak (steps 1,500-4,000), indicating higher variance or uncertainty in this metric during the early, rapid-change phase of training. The bands for Information gain are relatively consistent.
### Interpretation
This chart likely visualizes a phenomenon in machine learning model training where initial learning rapidly improves the model's fit to the training data (high R²), but prolonged training leads to a state where the model continues to gain information (perhaps from noise or spurious correlations) at the expense of its generalizable fit. The declining R² could indicate overfitting, where the model becomes too specialized to the training set's noise, or a shift in what the model is optimizing for.
The crossing point at ~8,000 steps is critical. It marks the transition where the model's information acquisition surpasses its measurable goodness-of-fit. The plateau in information gain suggests diminishing returns from further training beyond 15,000-20,000 steps for this particular metric. An investigator would use this chart to argue for **early stopping** (around the R² peak) to preserve generalization, or to question whether the "Information gain" metric is aligned with the desired model performance outcome.