## Line Graph: Training Step Analysis
### Overview
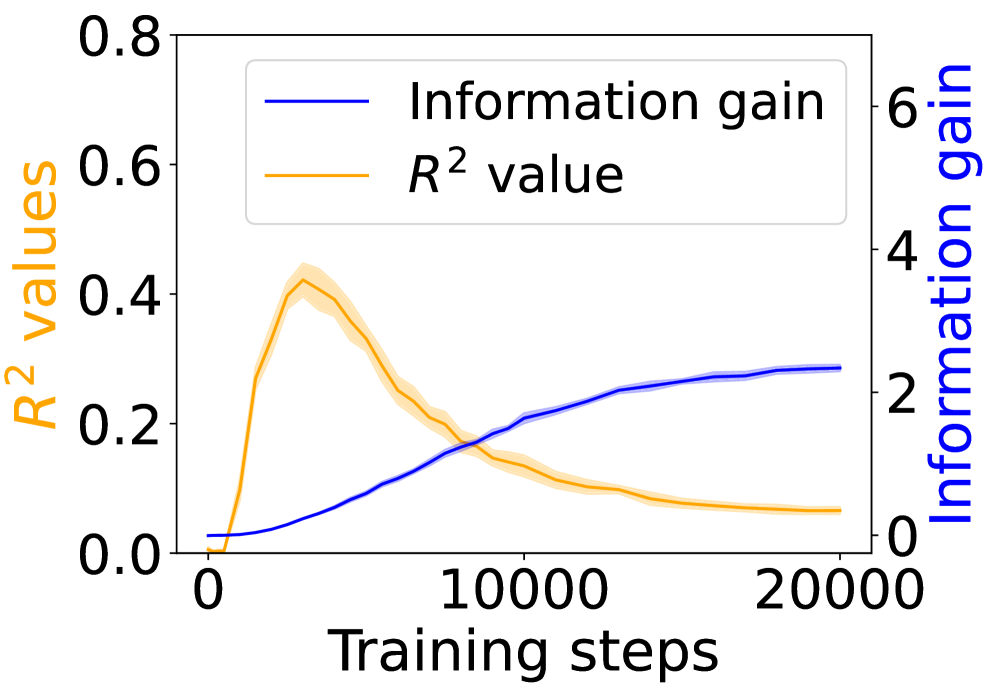
The image depicts a dual-axis line graph comparing two metrics across training steps: **R² values** (left y-axis) and **Information gain** (right y-axis). The x-axis represents training steps from 0 to 20,000. Two lines are plotted: a blue line for Information gain and an orange line for R² values, with shaded regions indicating variability or confidence intervals.
### Components/Axes
- **X-axis**: Training steps (0 to 20,000, linear scale).
- **Left Y-axis**: R² values (0 to 0.8, linear scale).
- **Right Y-axis**: Information gain (0 to 6, linear scale).
- **Legend**: Located in the top-left corner, with:
- Blue line: "Information gain"
- Orange line: "R² value"
### Detailed Analysis
1. **R² Value (Orange Line)**:
- Starts at 0.0 at 0 steps.
- Peaks sharply at ~0.4 around 5,000 steps.
- Declines steadily to ~0.1 by 20,000 steps.
- Shaded region (confidence interval) widens as R² decreases, indicating increasing uncertainty.
2. **Information Gain (Blue Line)**:
- Begins near 0 at 0 steps.
- Gradually increases, crossing the R² peak at ~5,000 steps.
- Plateaus at ~2.5–3.0 by 20,000 steps.
- Shaded region widens significantly after 10,000 steps, suggesting growing variability.
### Key Observations
- **Divergence at 5,000 steps**: R² peaks while Information gain continues rising, indicating a trade-off between model performance and information efficiency.
- **Post-10,000 steps**: R² declines sharply, while Information gain stabilizes, suggesting diminishing returns in model accuracy despite continued learning.
- **Confidence intervals**: Information gain’s uncertainty grows more pronounced than R²’s, implying less reliable gains at higher training steps.
### Interpretation
The graph highlights a critical tension in model training:
- **Early training (0–5,000 steps)**: Rapid improvement in both metrics, with R² reflecting strong initial performance gains.
- **Mid-to-late training (5,000–20,000 steps)**: R² degradation suggests overfitting or saturation, while Information gain’s plateau implies the model is extracting diminishing new insights. The widening confidence intervals for Information gain may indicate instability in later training phases.
This pattern underscores the need for careful hyperparameter tuning to balance model complexity (Information gain) and generalization (R²). The divergence after 5,000 steps warns against excessive training, which risks overfitting despite apparent learning progress.