## Bar Chart: Average Accuracy of LLM and PRM Combinations
### Overview
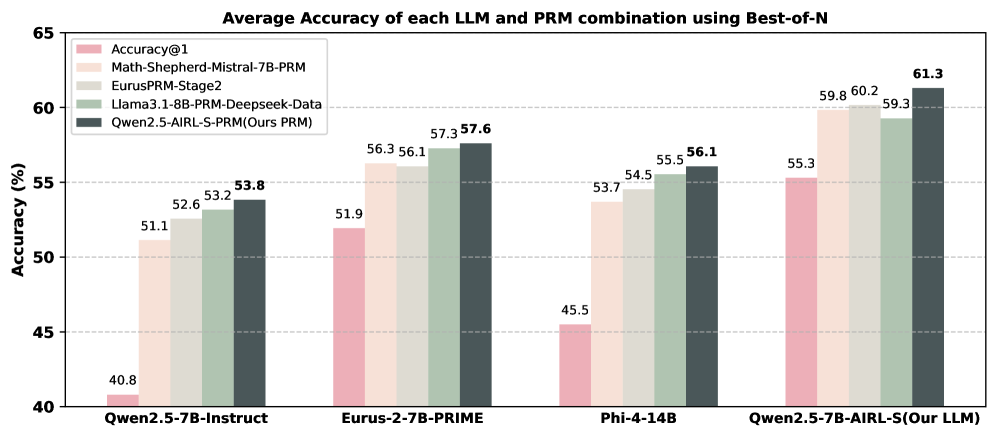
This bar chart displays the average accuracy of different Large Language Model (LLM) and Program-aided Reasoning Model (PRM) combinations, evaluated using a Best-of-N approach. The accuracy is measured in percentage (%). The chart compares four different LLM/PRM pairings.
### Components/Axes
* **Title:** "Average Accuracy of each LLM and PRM combination using Best-of-N" (Top-center)
* **X-axis:** LLM/PRM Combinations: "Qwen2.5-7B-Instruct", "Eurus-2-7B-PRIME", "Phi-4-14B", "Qwen2.5-7B-AIRL-S(Our LLM)" (Bottom-center)
* **Y-axis:** Accuracy (%) - Scale ranges from 40 to 65, with increments of 5. (Left-side)
* **Legend:** Located in the top-left corner, identifying the color-coded data series:
* Accuracy@1 (Pink)
* Math-Shepherd-Mistral-7B-PRM (Light Green)
* EurusPRM-Stage2 (Gray)
* Llama3.1-8B-PRM-Deepseek-Data (Dark Green)
* Qwen2.5-AIRL-S-PRM(Ours PRM) (Teal)
### Detailed Analysis
The chart consists of four groups of bars, each representing one LLM/PRM combination. Each group contains five bars, one for each PRM.
* **Qwen2.5-7B-Instruct:**
* Accuracy@1: 51.1%
* Math-Shepherd-Mistral-7B-PRM: 52.6%
* EurusPRM-Stage2: 53.8%
* Llama3.1-8B-PRM-Deepseek-Data: 40.8%
* Qwen2.5-AIRL-S-PRM(Ours PRM): 51.9%
* **Eurus-2-7B-PRIME:**
* Accuracy@1: 56.1%
* Math-Shepherd-Mistral-7B-PRM: 57.3%
* EurusPRM-Stage2: 56.3%
* Llama3.1-8B-PRM-Deepseek-Data: 57.6%
* Qwen2.5-AIRL-S-PRM(Ours PRM): 56.1%
* **Phi-4-14B:**
* Accuracy@1: 54.5%
* Math-Shepherd-Mistral-7B-PRM: 55.5%
* EurusPRM-Stage2: 53.7%
* Llama3.1-8B-PRM-Deepseek-Data: 45.5%
* Qwen2.5-AIRL-S-PRM(Ours PRM): 56.1%
* **Qwen2.5-7B-AIRL-S(Our LLM):**
* Accuracy@1: 59.8%
* Math-Shepherd-Mistral-7B-PRM: 60.2%
* EurusPRM-Stage2: 59.3%
* Llama3.1-8B-PRM-Deepseek-Data: 61.3%
* Qwen2.5-AIRL-S-PRM(Ours PRM): 55.3%
### Key Observations
* The "Qwen2.5-7B-AIRL-S(Our LLM)" combination consistently achieves the highest accuracy across most PRMs, with Llama3.1-8B-PRM-Deepseek-Data reaching 61.3%.
* "Llama3.1-8B-PRM-Deepseek-Data" generally performs the worst, especially with "Qwen2.5-7B-Instruct" (40.8%).
* "Math-Shepherd-Mistral-7B-PRM" and "EurusPRM-Stage2" consistently show relatively high performance across all LLM combinations.
* The accuracy values are relatively close for many combinations, suggesting that the choice of PRM has a significant impact on performance.
### Interpretation
The data suggests that the "Qwen2.5-7B-AIRL-S" LLM, when paired with different PRMs, demonstrates superior performance compared to the other LLM models tested. The "Llama3.1-8B-PRM-Deepseek-Data" pairing consistently underperforms, indicating a potential incompatibility or limitation within this combination. The relatively small differences in accuracy between the PRMs for a given LLM suggest that the PRM selection is crucial for optimizing performance. The chart highlights the importance of carefully selecting both the LLM and PRM components to achieve the best possible accuracy in a combined system. The "Our PRM" (Qwen2.5-AIRL-S-PRM) shows competitive results, but doesn't consistently outperform the other PRMs. The data implies that the "Best-of-N" approach is effective in improving accuracy, as evidenced by the higher values achieved compared to a single prediction.