## Diagram: Process Flow Equivalence
### Overview
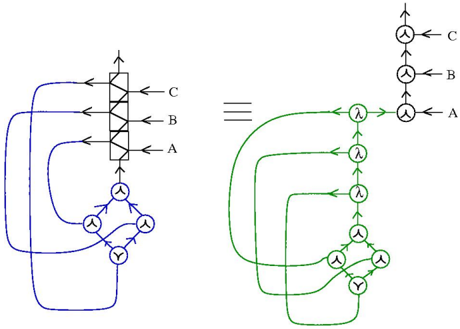
The image presents two interconnected diagrams (blue on the left, green on the right) linked by an equivalence symbol (≡). Both diagrams use arrows, labeled nodes, and symbolic elements to represent processes or relationships.
### Components/Axes
- **Left Diagram (Blue)**:
- **Top Box**: A labeled box with internal grid lines, connected to three arrows labeled **A**, **B**, and **C** pointing outward.
- **Lower Nodes**: Three interconnected circles with triangle symbols (▲) and one circle with a **Y** symbol. Arrows form a loop between these nodes.
- **Flow**: Arrows from the box point to the lower nodes, and internal arrows create a feedback loop.
- **Right Diagram (Green)**:
- **Vertical Stack**: Three circles labeled **C**, **B**, and **A** (top to bottom), connected by upward-pointing arrows.
- **Lower Loop**: A cluster of circles with lambda symbols (λ) and **Y** symbols, connected by arrows forming a closed loop.
- **Flow**: Arrows from the vertical stack point to the lower loop, with internal arrows creating a feedback cycle.
- **Equivalence Symbol**: A horizontal ≡ symbol connects the two diagrams, suggesting they represent equivalent processes.
### Detailed Analysis
- **Left Diagram**:
- The box (A, B, C) likely represents a decision or input stage, with arrows directing flow to the lower nodes.
- The lower nodes (▲, Y) may symbolize intermediate states or operations, with the loop indicating cyclical processing.
- **Right Diagram**:
- The vertical stack (C → B → A) suggests a hierarchical or sequential process, with arrows pointing upward.
- The lower loop (λ, Y) mirrors the left diagram’s feedback structure, implying equivalence in operational logic.
### Key Observations
1. **Symbolic Consistency**: Both diagrams use **Y** symbols and loops, suggesting shared functional roles.
2. **Directional Flow**: Arrows in both diagrams point toward the lower nodes, emphasizing a bottom-up or cyclical process.
3. **Equivalence**: The ≡ symbol implies the diagrams are interchangeable representations of the same system.
### Interpretation
The diagrams likely model a process where inputs (A, B, C) are processed through intermediate states (▲, λ, Y) with feedback loops. The left diagram’s box may represent a centralized control or input hub, while the right diagram’s vertical stack suggests a hierarchical structure. The equivalence symbol indicates that despite differences in visual representation, both diagrams describe the same underlying logic. The use of **Y** and looped arrows emphasizes iterative or recursive operations, possibly in computational or decision-making contexts.