## Line Chart: Federated Learning Performance on CIFAR-10
### Overview
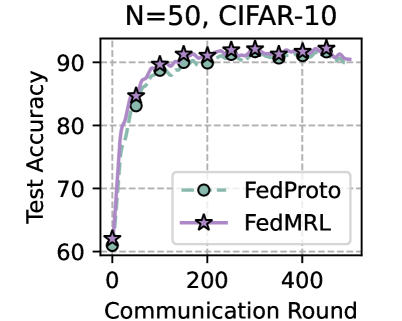
The image is a line chart comparing the test accuracy of two federated learning methods, FedProto and FedMRL, over the course of training. The chart is titled "N=50, CIFAR-10", indicating the experiment was conducted with 50 clients on the CIFAR-10 dataset. The x-axis represents the communication rounds between clients and a central server, while the y-axis shows the test accuracy percentage.
### Components/Axes
* **Title:** "N=50, CIFAR-10" (Top center)
* **Y-Axis:** Label is "Test Accuracy". Scale ranges from 60 to 90, with major tick marks at 60, 70, 80, and 90.
* **X-Axis:** Label is "Communication Round". Scale ranges from 0 to approximately 500, with major tick marks labeled at 0, 200, and 400.
* **Legend:** Located in the bottom-right quadrant of the chart area.
* **FedProto:** Represented by a green dashed line with open circle markers.
* **FedMRL:** Represented by a purple solid line with star markers.
* **Grid:** A light gray grid is present in the background.
### Detailed Analysis
**Trend Verification:**
* **FedProto (Green, Circles):** The line shows a steep, logarithmic-like increase in accuracy from round 0, then plateaus. The trend is strongly upward initially, then flattens.
* **FedMRL (Purple, Stars):** This line follows a very similar trajectory to FedProto but maintains a consistently higher accuracy after the initial rounds. Its trend is also steeply upward before plateauing.
**Data Point Extraction (Approximate Values):**
* **Round 0:** Both methods start at approximately **60%** accuracy.
* **Round ~50:** FedProto is at ~83%. FedMRL is at ~85%.
* **Round ~100:** FedProto reaches ~90%. FedMRL is at ~91%.
* **Round 200:** FedProto is at ~91%. FedMRL is at ~92%.
* **Rounds 200-500:** Both lines plateau with minor fluctuations.
* FedProto fluctuates between approximately **91% and 92%**.
* FedMRL fluctuates between approximately **92% and 93%**, consistently appearing 1-2 percentage points above FedProto.
* **Final Round (~500):** FedProto is at ~92%. FedMRL is at ~93%.
### Key Observations
1. **Rapid Convergence:** Both models achieve over 90% test accuracy within the first 100-150 communication rounds.
2. **Performance Gap:** FedMRL demonstrates a small but consistent performance advantage over FedProto throughout the training process after the initial rounds.
3. **Stability:** After round 200, both methods show stable performance with very low variance, indicating convergence.
4. **Identical Starting Point:** Both methods begin at the same baseline accuracy (~60%) at round 0.
### Interpretation
The chart demonstrates the effectiveness of both FedProto and FedMRL federated learning algorithms on the CIFAR-10 image classification task with 50 participating clients. The key takeaway is that **FedMRL achieves a slightly higher final test accuracy (~93%) compared to FedProto (~92%)** under these experimental conditions.
The steep initial ascent indicates that both methods are highly efficient at learning from distributed data in the early stages of communication. The plateau suggests that further communication rounds beyond 200 yield diminishing returns for accuracy improvement. The consistent gap between the lines implies that the FedMRL method may have a superior model aggregation or personalization mechanism that leads to better generalization on the test set. The "N=50" parameter is crucial context, as federated learning performance can be highly sensitive to the number of clients.