## Bar Chart: Accuracy vs. Pass@1 of qT
### Overview
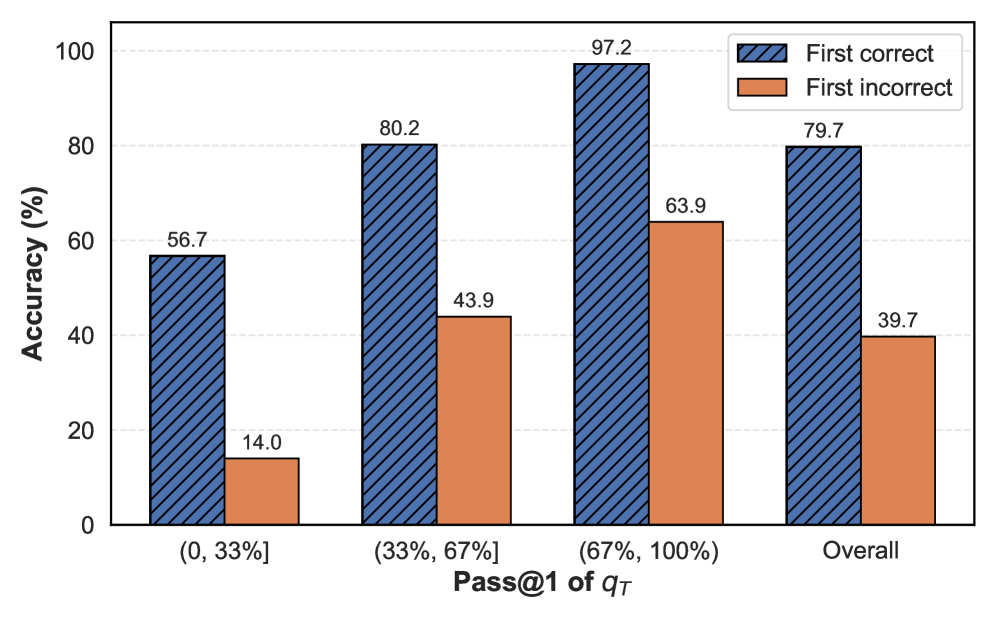
The image is a bar chart comparing the accuracy of "First correct" and "First incorrect" results across different ranges of "Pass@1 of qT" values, as well as an overall accuracy. The x-axis represents the "Pass@1 of qT" in percentage ranges, and the y-axis represents the accuracy in percentage.
### Components/Axes
* **X-axis:** "Pass@1 of qT" with categories: (0, 33%], (33%, 67%], (67%, 100%], and Overall.
* **Y-axis:** "Accuracy (%)" with a scale from 0 to 100 in increments of 20.
* **Legend:** Located in the top-right corner.
* Blue, diagonally striped bars: "First correct"
* Orange bars: "First incorrect"
### Detailed Analysis
The chart presents accuracy data for two categories: "First correct" and "First incorrect," across different ranges of "Pass@1 of qT."
* **(0, 33%] Range:**
* "First correct": 56.7%
* "First incorrect": 14.0%
* **(33%, 67%] Range:**
* "First correct": 80.2%
* "First incorrect": 43.9%
* **(67%, 100%] Range:**
* "First correct": 97.2%
* "First incorrect": 63.9%
* **Overall:**
* "First correct": 79.7%
* "First incorrect": 39.7%
**Trend Verification:**
* The "First correct" accuracy generally increases as the "Pass@1 of qT" range increases.
* The "First incorrect" accuracy also increases as the "Pass@1 of qT" range increases.
### Key Observations
* The "First correct" accuracy is consistently higher than the "First incorrect" accuracy across all "Pass@1 of qT" ranges and overall.
* The highest "First correct" accuracy is observed in the (67%, 100%] range.
* The lowest "First correct" accuracy is observed in the (0, 33%] range.
* The difference between "First correct" and "First incorrect" accuracy is largest in the (0, 33%] range and smallest in the (67%, 100%] range.
### Interpretation
The data suggests that as the "Pass@1 of qT" increases, the accuracy of both "First correct" and "First incorrect" results improves. This indicates a positive correlation between "Pass@1 of qT" and accuracy. The higher "First correct" accuracy compared to "First incorrect" accuracy across all ranges suggests that the model is generally more successful in providing correct answers on the first attempt. The increasing "First incorrect" accuracy with increasing "Pass@1 of qT" might indicate that even when the first attempt is incorrect, the model's performance improves with higher "Pass@1 of qT." The overall accuracy values provide a general measure of the model's performance across all "Pass@1 of qT" ranges.