## Diagram: Model Output for a Factual Question
### Overview
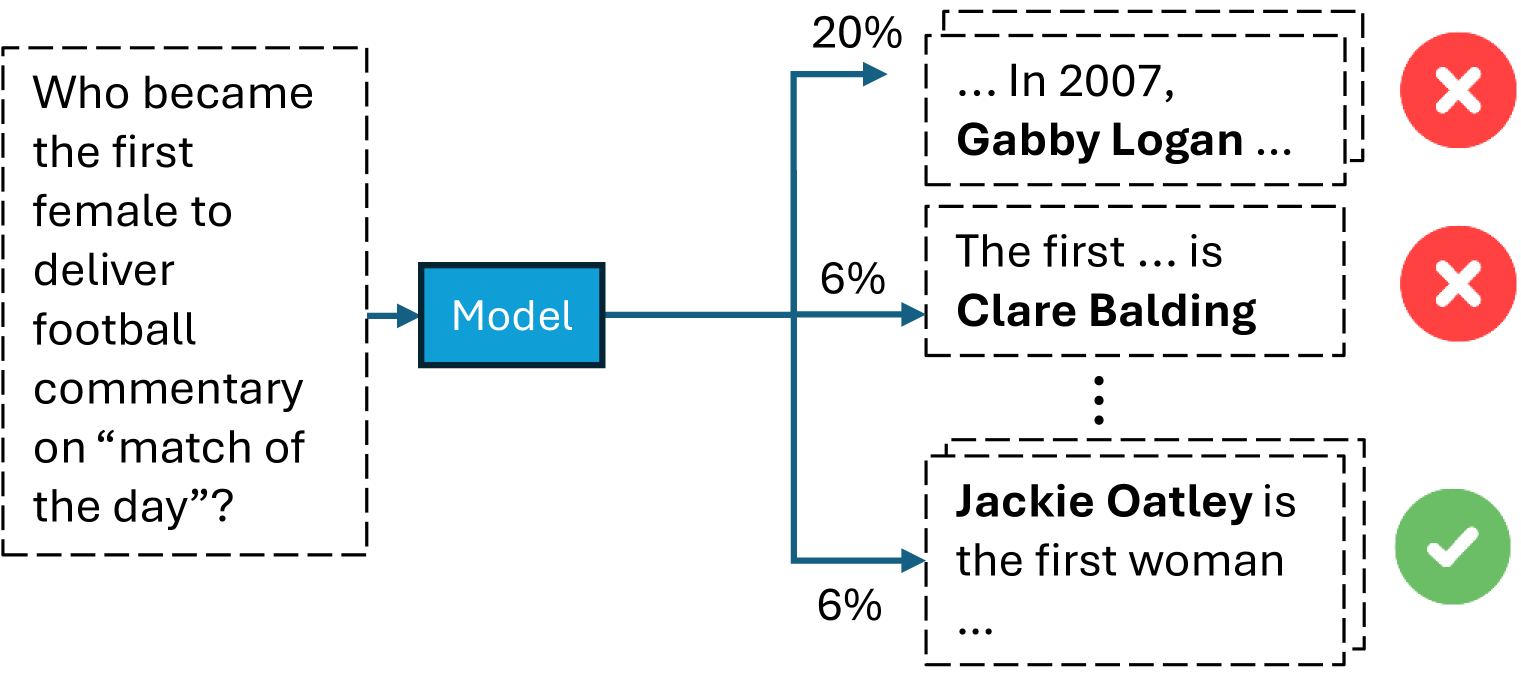
This image is a flowchart or diagram illustrating the output of a machine learning model ("Model") when given a specific factual question. The diagram shows the input question, the model processing it, and three possible generated answers, each associated with a confidence percentage and a correctness indicator (correct or incorrect).
### Components/Axes
The diagram is structured horizontally, flowing from left to right.
1. **Input (Left):** A dashed-line box containing the question text.
2. **Processing (Center):** A solid blue rectangle labeled "Model".
3. **Outputs (Right):** Three dashed-line boxes, each containing a partial answer text. Each output is connected to the model by a blue arrow.
- **Output 1 (Top):** Arrow labeled "20%". Box contains text. To its right is a red circle with a white "X".
- **Output 2 (Middle):** Arrow labeled "6%". Box contains text. To its right is a red circle with a white "X".
- **Output 3 (Bottom):** Arrow labeled "6%". Box contains text. To its right is a green circle with a white checkmark.
- Vertical ellipsis (`:`) between Output 2 and Output 3, suggesting additional, unshown outputs.
### Detailed Analysis
**1. Input Question:**
- **Text:** "Who became the first female to deliver football commentary on 'match of the day'?"
- **Language:** English.
**2. Model Outputs:**
- **Output 1 (Top, 20% confidence):**
- **Text:** "... In 2007, **Gabby Logan** ..."
- **Correctness Indicator:** Red circle with white "X" (Incorrect).
- **Output 2 (Middle, 6% confidence):**
- **Text:** "The first ... is **Clare Balding**"
- **Correctness Indicator:** Red circle with white "X" (Incorrect).
- **Output 3 (Bottom, 6% confidence):**
- **Text:** "**Jackie Oatley** is the first woman ..."
- **Correctness Indicator:** Green circle with white checkmark (Correct).
**3. Spatial Grounding & Visual Flow:**
- The input question is positioned on the far left.
- The "Model" box is centered vertically, acting as the processing node.
- The three outputs are stacked vertically on the right. The highest confidence output (20%) is at the top, followed by the two lower confidence outputs (6% each).
- The correctness indicators are placed immediately to the right of their respective answer boxes, providing a clear visual verdict.
### Key Observations
1. **Confidence vs. Accuracy Mismatch:** The model assigns its highest confidence (20%) to an incorrect answer (Gabby Logan). The correct answer (Jackie Oatley) is generated with a much lower confidence score (6%), equal to another incorrect answer (Clare Balding).
2. **Output Distribution:** The diagram explicitly shows three outputs but uses a vertical ellipsis to imply the model generates a distribution over many possible answers, not just these three.
3. **Answer Specificity:** The correct answer identifies a specific individual, "Jackie Oatley." The incorrect answers also name specific individuals, suggesting the model is retrieving or generating plausible but factually wrong entities.
4. **Temporal Reference:** One incorrect answer includes a specific year ("2007"), which may be a confabulated detail associated with the wrong person.
### Interpretation
This diagram serves as a clear visual critique of a common failure mode in language models: **poor calibration between confidence and factual accuracy.** It demonstrates that a model can be more confident in a wrong answer than in the correct one.
The data suggests the model's internal probability distribution for this question is misaligned with ground truth. The high confidence in "Gabby Logan" might stem from her being a well-known sports presenter, creating a strong but incorrect association. The lower confidence for the correct answer, "Jackie Oatley," indicates the model has learned the fact but assigns it lower probability, possibly due to less frequent training data or competing associations.
The inclusion of the ellipsis is crucial—it shows this is a snapshot of a larger output distribution, emphasizing that the model considers many possibilities, and the shown examples are just the top or most illustrative ones. This highlights the challenge of extracting reliable, single answers from probabilistic models without additional verification or confidence-thresholding mechanisms. The diagram effectively argues for the need to evaluate not just if a model can produce a correct answer, but how confidently it does so.