## Line Chart: Average Cost vs. Epoch for Different PNN Configurations
### Overview
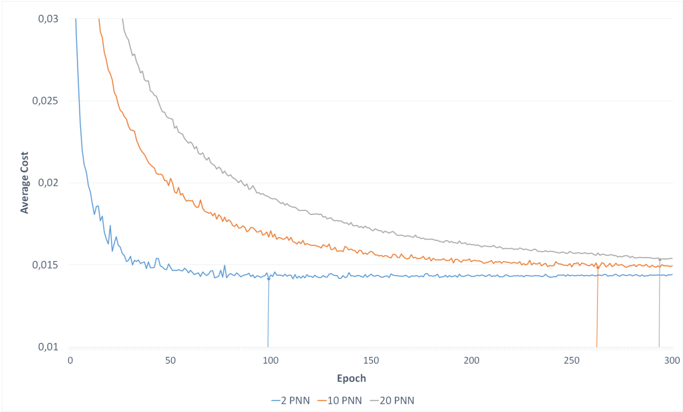
The image is a line chart comparing the average cost (error) of three different Probabilistic Neural Network (PNN) configurations (2 PNN, 10 PNN, and 20 PNN) over 300 epochs. The chart illustrates how the average cost decreases with increasing epochs for each configuration, eventually plateauing.
### Components/Axes
* **X-axis:** Epoch, ranging from 0 to 300 in increments of 50.
* **Y-axis:** Average Cost, ranging from 0.01 to 0.03 in increments of 0.005.
* **Legend:** Located at the bottom of the chart.
* Blue line: 2 PNN
* Orange line: 10 PNN
* Gray line: 20 PNN
### Detailed Analysis
* **2 PNN (Blue Line):**
* Trend: The average cost decreases rapidly in the initial epochs and then plateaus.
* Approximate Values: Starts around 0.03, drops to approximately 0.015 by epoch 50, and stabilizes around 0.014-0.015 after epoch 100.
* **10 PNN (Orange Line):**
* Trend: The average cost decreases steadily and then plateaus.
* Approximate Values: Starts around 0.03, drops to approximately 0.017 by epoch 100, and stabilizes around 0.015 after epoch 200.
* **20 PNN (Gray Line):**
* Trend: The average cost decreases gradually and then plateaus.
* Approximate Values: Starts around 0.03, drops to approximately 0.02 by epoch 100, and stabilizes around 0.016-0.017 after epoch 250.
### Key Observations
* All three PNN configurations show a decreasing trend in average cost as the number of epochs increases.
* The 2 PNN configuration shows the most rapid initial decrease in average cost but also exhibits more fluctuation.
* The 20 PNN configuration shows the slowest initial decrease in average cost but appears to stabilize more smoothly.
* After approximately 200 epochs, the average cost for all three configurations converges to a similar range (0.014-0.017).
### Interpretation
The chart demonstrates the learning process of the PNN models. As the models are trained over more epochs, their average cost (error) decreases, indicating improved performance. The different PNN configurations exhibit varying learning rates and stability. The 2 PNN configuration learns quickly but is less stable, while the 20 PNN configuration learns more slowly but is more stable. The convergence of the average cost for all configurations after a sufficient number of epochs suggests that there is a limit to the improvement achievable with further training. The choice of PNN configuration may depend on the specific application and the trade-off between learning speed and stability.