\n
## Line Charts: Problem Solving Performance with Different Generators and Verifiers
### Overview
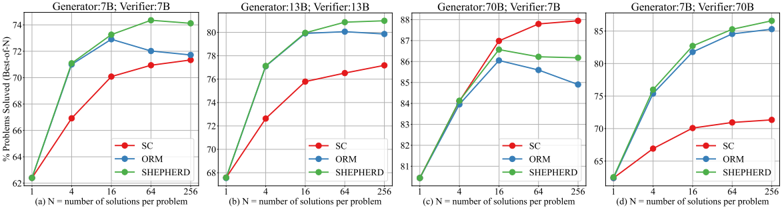
The image presents four separate line charts, each comparing the performance of three different problem-solving methods ("SC", "ORM", and "SHEPHERD") as the number of solutions considered increases. Each chart corresponds to a specific combination of "Generator" and "Verifier" sizes (7B, 13B, 70B). The y-axis represents the percentage of problems solved (Best-of-1), and the x-axis represents the number of solutions per problem.
### Components/Axes
Each chart shares the following components:
* **X-axis Label:** "(N) = number of solutions per problem" with markers at 1, 4, 16, 64, and 256.
* **Y-axis Label:** "% Problems Solved (Best-of-1)" with a scale ranging from approximately 62% to 88%.
* **Legend:** Located in the bottom-left corner of each chart, listing the three methods:
* "SC" (Red)
* "ORM" (Blue)
* "SHEPHERD" (Green)
* **Title:** Each chart has a title indicating the Generator and Verifier sizes.
* (a) Generator: 7B; Verifier: 7B
* (b) Generator: 13B; Verifier: 13B
* (c) Generator: 70B; Verifier: 7B
* (d) Generator: 7B; Verifier: 70B
### Detailed Analysis or Content Details
**Chart (a): Generator: 7B; Verifier: 7B**
* **SC (Red):** Starts at approximately 62% at N=1, increases steadily to around 76% at N=64, and plateaus at approximately 76% at N=256.
* **ORM (Blue):** Starts at approximately 70% at N=1, increases to around 78% at N=4, continues to increase to approximately 81% at N=16, then plateaus around 81% at N=64 and N=256.
* **SHEPHERD (Green):** Starts at approximately 68% at N=1, increases rapidly to around 78% at N=4, continues to increase to approximately 80% at N=16, and plateaus around 80% at N=64 and N=256.
**Chart (b): Generator: 13B; Verifier: 13B**
* **SC (Red):** Starts at approximately 68% at N=1, increases to around 74% at N=64, and plateaus at approximately 74% at N=256.
* **ORM (Blue):** Starts at approximately 72% at N=1, increases to around 78% at N=4, continues to increase to approximately 80% at N=16, and plateaus around 80% at N=64 and N=256.
* **SHEPHERD (Green):** Starts at approximately 70% at N=1, increases to around 77% at N=4, continues to increase to approximately 80% at N=16, and plateaus around 80% at N=64 and N=256.
**Chart (c): Generator: 70B; Verifier: 7B**
* **SC (Red):** Starts at approximately 82% at N=1, increases to around 86% at N=4, continues to increase to approximately 88% at N=16, and plateaus around 88% at N=64 and N=256.
* **ORM (Blue):** Starts at approximately 84% at N=1, increases to around 86% at N=4, continues to increase to approximately 87% at N=16, and plateaus around 86% at N=64 and N=256.
* **SHEPHERD (Green):** Starts at approximately 83% at N=1, increases to around 87% at N=4, continues to increase to approximately 88% at N=16, and plateaus around 88% at N=64 and N=256.
**Chart (d): Generator: 7B; Verifier: 70B**
* **SC (Red):** Starts at approximately 65% at N=1, increases to around 70% at N=4, continues to increase to approximately 72% at N=16, and plateaus around 72% at N=64 and N=256.
* **ORM (Blue):** Starts at approximately 75% at N=1, increases to around 80% at N=4, continues to increase to approximately 82% at N=16, and plateaus around 82% at N=64 and N=256.
* **SHEPHERD (Green):** Starts at approximately 70% at N=1, increases to around 78% at N=4, continues to increase to approximately 82% at N=16, and plateaus around 82% at N=64 and N=256.
### Key Observations
* Increasing the number of solutions considered (N) generally improves performance for all methods, but the gains diminish beyond N=16.
* The combination of a 70B Generator and a 7B Verifier (Chart c) consistently yields the highest performance across all methods.
* The 7B Generator and 70B Verifier (Chart d) shows the lowest overall performance.
* SHEPHERD generally outperforms SC, while ORM often performs similarly to or slightly better than SHEPHERD.
### Interpretation
The data suggests that the size of the generator significantly impacts problem-solving performance. A larger generator (70B) leads to higher success rates, even when paired with a smaller verifier (7B). The verifier size also plays a role, but its impact is less pronounced than the generator size. The diminishing returns observed beyond N=16 indicate that there's a point where considering more solutions doesn't significantly improve the outcome.
The relative performance of the methods (SC, ORM, SHEPHERD) appears to be consistent across different generator/verifier configurations, with SHEPHERD generally being superior to SC and ORM often performing comparably to SHEPHERD. This suggests that the underlying strengths and weaknesses of each method are relatively independent of the model sizes used.
The outlier is the 7B Generator and 70B Verifier combination (Chart d), which shows the lowest overall performance. This could indicate a bottleneck in the generator's ability to produce high-quality solutions that the larger verifier can effectively evaluate. It could also suggest that the verifier's capacity is not fully utilized when paired with a smaller generator.