## Line Charts: Performance Scaling with Number of Solutions (N)
### Overview
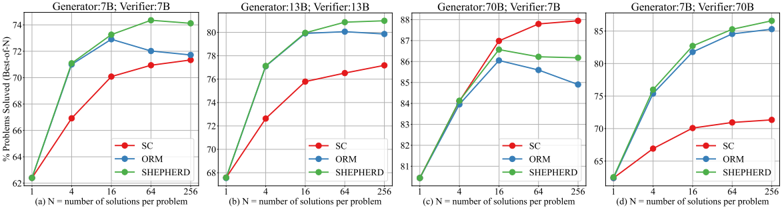
The image contains four line charts arranged horizontally, labeled (a) through (d). Each chart plots the percentage of problems solved (y-axis) against the number of solutions per problem, N (x-axis, logarithmic scale). The charts compare the performance of three methods—SC, ORM, and SHEPHERD—across different configurations of Generator and Verifier model sizes (measured in billions of parameters, B).
### Components/Axes
* **Common Elements (All Charts):**
* **X-axis:** Label: `N = number of solutions per problem`. Scale: Logarithmic, with markers at `1`, `4`, `16`, `64`, `256`.
* **Y-axis:** Label: `% Problems Solved (Base=N)`. Scale: Linear, but the range varies per subplot.
* **Legend:** Located in the top-left corner of each subplot. Contains three entries:
* `SC` (Red line with circular markers)
* `ORM` (Blue line with circular markers)
* `SHEPHERD` (Green line with circular markers)
* **Subplot-Specific Titles (Top of each chart):**
* (a) `Generator:7B, Verifier:7B`
* (b) `Generator:13B, Verifier:13B`
* (c) `Generator:70B, Verifier:70B`
* (d) `Generator:7B, Verifier:70B`
### Detailed Analysis
**Chart (a): Generator:7B, Verifier:7B**
* **Y-axis Range:** 62% to 74%.
* **Data Series Trends & Approximate Points:**
* **SC (Red):** Shows a steady, concave-down increase. Starts lowest at N=1 (~62%), rises to ~70% at N=16, and ends at ~71.5% at N=256.
* **ORM (Blue):** Increases to a peak and then declines. Starts at ~62% (N=1), peaks at ~73% (N=16), then falls to ~71.5% (N=256).
* **SHEPHERD (Green):** Shows the steepest and most sustained increase. Starts at ~62% (N=1), surpasses ORM by N=64 (~73.5%), and reaches the highest value of ~74% at N=256.
**Chart (b): Generator:13B, Verifier:13B**
* **Y-axis Range:** 68% to 80%.
* **Data Series Trends & Approximate Points:**
* **SC (Red):** Steady increase. Starts at ~68% (N=1), reaches ~76% (N=16), and ends at ~77% (N=256).
* **ORM (Blue):** Increases to a peak and then declines. Starts at ~68% (N=1), peaks at ~79% (N=16), then falls to ~78% (N=256).
* **SHEPHERD (Green):** Strong, sustained increase. Starts at ~68% (N=1), matches ORM at N=16 (~79%), and continues rising to ~80% at N=256, becoming the top performer.
**Chart (c): Generator:70B, Verifier:70B**
* **Y-axis Range:** 80% to 88%.
* **Data Series Trends & Approximate Points:**
* **SC (Red):** Strong, steady increase. Starts at ~80% (N=1), rises to ~87% (N=16), and ends at ~88% (N=256).
* **ORM (Blue):** Increases to a peak and then declines. Starts at ~80% (N=1), peaks at ~86% (N=16), then falls to ~85% (N=256).
* **SHEPHERD (Green):** Increases and then plateaus. Starts at ~80% (N=1), rises to ~86.5% (N=16), and remains around ~86.5% through N=256.
**Chart (d): Generator:7B, Verifier:70B**
* **Y-axis Range:** 65% to 85%.
* **Data Series Trends & Approximate Points:**
* **SC (Red):** Increases and then plateaus. Starts at ~65% (N=1), rises to ~70% (N=16), and ends at ~71% (N=256).
* **ORM (Blue):** Shows a strong, sustained increase. Starts at ~65% (N=1), rises to ~82% (N=16), and continues to ~85% at N=256.
* **SHEPHERD (Green):** Shows the strongest, most sustained increase. Starts at ~65% (N=1), rises to ~83% (N=16), and reaches the highest value of ~86% at N=256.
### Key Observations
1. **SHEPHERD's Scaling:** The SHEPHERD method (green) consistently shows the most robust positive scaling with N across all configurations. It either becomes the top performer at high N (charts a, b, d) or maintains a high plateau (chart c).
2. **ORM's Peak and Decline:** The ORM method (blue) consistently peaks at N=16 in charts (a), (b), and (c), after which its performance declines as N increases to 64 and 256. This negative scaling at high N is a notable anomaly.
3. **Impact of Model Size:** Moving from 7B (a) to 13B (b) to 70B (c) models (matched generator/verifier) shifts the entire performance range upward (from ~62-74% to ~68-80% to ~80-88%).
4. **Verifier vs. Generator Size:** Chart (d) isolates the effect of a large verifier (70B) with a small generator (7B). Compared to chart (a) (both 7B), performance is dramatically higher (up to ~86% vs. ~74%), suggesting verifier size is a critical factor. In this configuration, both SHEPHERD and ORM scale very well with N, unlike SC which plateaus.
### Interpretation
This data demonstrates the relationship between inference-time compute (number of solutions, N) and problem-solving accuracy for different methods and model scales. The key finding is that the **SHEPHERD method is uniquely effective at converting additional compute (higher N) into improved accuracy**, showing positive scaling where other methods plateau or even decline.
The anomalous decline of ORM at high N in matched-size models (a, b, c) suggests a potential failure mode or inefficiency in its verification or aggregation process when overwhelmed with many candidate solutions. In contrast, the strong performance in chart (d) indicates that a powerful verifier can mitigate this issue, even with a weaker generator.
Overall, the charts argue that for maximizing the benefit of increased inference compute (scaling N), the choice of method (SHEPHERD) and the relative scale of the verifier model are more critical than simply scaling both generator and verifier together. The data provides a practical guide for resource allocation in AI problem-solving systems.