# Technical Document Extraction: Iteratively Revising Answers at Test-time
This document contains a detailed extraction of data and trends from a technical visualization consisting of two primary charts regarding Large Language Model (LLM) performance optimization.
---
## 1. Overall Header
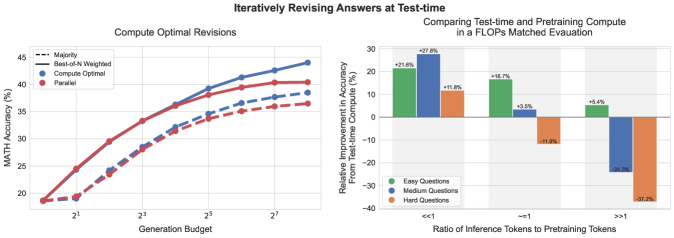
**Title:** Iteratively Revising Answers at Test-time
---
## 2. Left Chart: Compute Optimal Revisions
### Component Isolation
* **Region:** Main Chart (Left)
* **Title:** Compute Optimal Revisions
* **Y-Axis Label:** MATH Accuracy (%)
* **Y-Axis Markers:** 20, 25, 30, 35, 40, 45
* **X-Axis Label:** Generation Budget
* **X-Axis Markers (Log Scale):** $2^1, 2^3, 2^5, 2^7$
* **Legend Location:** Top Left [x≈0.05, y≈0.85]
### Legend and Data Series Identification
1. **Majority (Dashed Line):** Represents the baseline performance using majority voting.
2. **Best-of-N Weighted (Solid Line):** Represents performance using a weighted selection method.
3. **Compute Optimal (Blue Points/Lines):** Data series focused on optimized compute allocation.
4. **Parallel (Red Points/Lines):** Data series focused on parallel generation.
### Trend Verification
* **General Trend:** All four data series show a logarithmic growth pattern. Accuracy increases sharply as the generation budget moves from $2^0$ to $2^4$, then begins to plateau as it approaches $2^8$.
* **Comparison:** The solid lines (Best-of-N Weighted) consistently outperform the dashed lines (Majority). Within the solid lines, the Blue (Compute Optimal) series begins to pull away from the Red (Parallel) series as the budget increases beyond $2^4$.
### Data Point Extraction (Approximate Values)
| Generation Budget ($2^x$) | Compute Optimal (Solid Blue) | Parallel (Solid Red) | Compute Optimal (Dashed Blue) | Parallel (Dashed Red) |
| :--- | :--- | :--- | :--- | :--- |
| $2^0$ (1) | ~18% | ~18% | ~18% | ~18% |
| $2^1$ (2) | ~24% | ~24% | ~19% | ~19% |
| $2^2$ (4) | ~29% | ~29% | ~24% | ~23% |
| $2^3$ (8) | ~33% | ~33% | ~28% | ~28% |
| $2^4$ (16) | ~36% | ~36% | ~32% | ~31% |
| $2^5$ (32) | ~39% | ~38% | ~34% | ~33% |
| $2^6$ (64) | ~41% | ~39% | ~36% | ~35% |
| $2^7$ (128) | ~42% | ~40% | ~37% | ~36% |
| $2^8$ (256) | ~44% | ~40% | ~38% | ~36% |
---
## 3. Right Chart: Comparing Test-time and Pretraining Compute
### Component Isolation
* **Region:** Main Chart (Right)
* **Title:** Comparing Test-time and Pretraining Compute in a FLOPs Matched Evaluation
* **Y-Axis Label:** Relative Improvement in Accuracy From Test-time Compute (%)
* **Y-Axis Markers:** -40, -30, -20, -10, 0, 10, 20, 30
* **X-Axis Label:** Ratio of Inference Tokens to Pretraining Tokens
* **X-Axis Categories:** $<<1$, $\approx 1$, $>>1$
* **Legend Location:** Bottom Left [x≈0.55, y≈0.15]
### Legend Identification
* **Green Bar:** Easy Questions
* **Blue Bar:** Medium Questions
* **Orange Bar:** Hard Questions
### Trend Verification
* **$<<1$ Ratio:** All question difficulties show positive improvement when test-time compute is much lower than pretraining compute. Medium questions benefit the most.
* **$\approx 1$ Ratio:** Easy and Medium questions still show improvement, but Hard questions show a significant performance degradation (-11.9%).
* **$>>1$ Ratio:** Only Easy questions show a slight improvement (+5.4%). Medium and Hard questions show massive performance drops, with Hard questions being the most negatively impacted (-37.2%).
### Data Table Extraction
| Ratio Category | Easy Questions (Green) | Medium Questions (Blue) | Hard Questions (Orange) |
| :--- | :--- | :--- | :--- |
| **$<<1$** | +21.6% | +27.8% | +11.8% |
| **$\approx 1$** | +16.7% | +3.5% | -11.9% |
| **$>>1$** | +5.4% | -24.3% | -37.2% |
---
## 4. Summary of Findings
The data suggests that while increasing the generation budget (test-time compute) generally improves accuracy, there is a point of diminishing returns. Furthermore, the effectiveness of test-time compute is highly dependent on the ratio of inference tokens to pretraining tokens; as this ratio increases (meaning more compute is spent at inference relative to training), the accuracy on medium and hard questions degrades significantly, while easy questions remain relatively stable.