## Chart: Error Bounds
### Overview
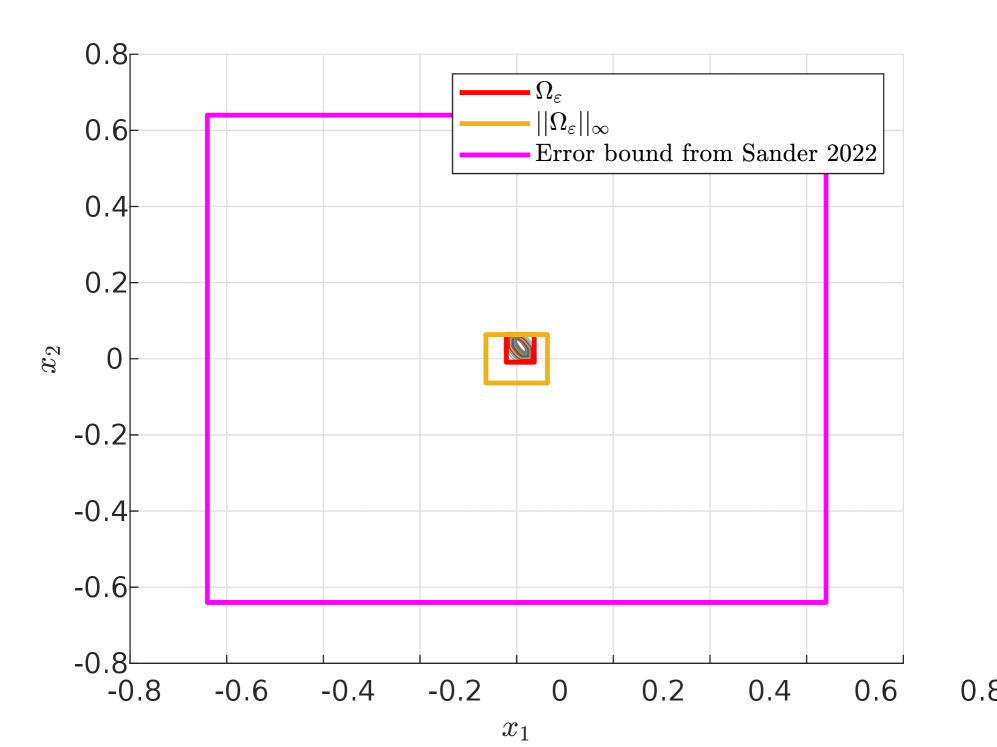
The image is a 2D plot showing error bounds in the x1-x2 plane. It displays three rectangular regions representing different error estimates: Omega_epsilon (red), the infinity norm of Omega_epsilon (orange), and an error bound from Sander 2022 (magenta). The plot is centered around the origin (0,0).
### Components/Axes
* **X-axis:** x1, ranging from -0.8 to 0.8 with increments of 0.2.
* **Y-axis:** x2, ranging from -0.8 to 0.8 with increments of 0.2.
* **Legend (top-right):**
* Red line: Ωε
* Orange line: ||Ωε||∞
* Magenta line: Error bound from Sander 2022
### Detailed Analysis
* **Red line (Ωε):** Forms a small square centered around (0,0). The approximate coordinates of the square's corners are (-0.05, 0.05), (0.05, 0.05), (0.05, -0.05), and (-0.05, -0.05).
* **Orange line (||Ωε||∞):** Forms a larger square, also centered around (0,0). The approximate coordinates of the square's corners are (-0.15, 0.15), (0.15, 0.15), (0.15, -0.15), and (-0.15, -0.15).
* **Magenta line (Error bound from Sander 2022):** Forms the largest square, centered around (0,0). The approximate coordinates of the square's corners are (-0.65, 0.65), (0.65, 0.65), (0.65, -0.65), and (-0.65, -0.65).
### Key Observations
* All three error bounds are represented as squares aligned with the axes.
* The error bounds are nested, with the red square (Ωε) being the smallest, followed by the orange square (||Ωε||∞), and the magenta square (Error bound from Sander 2022) being the largest.
* The plot suggests that the error bound from Sander 2022 is significantly larger than the other two error estimates.
### Interpretation
The plot visualizes different error bounds for a system or model. The nested squares indicate that the error estimates vary in their conservativeness. The error bound from Sander 2022 is the most conservative (largest), while Ωε is the least conservative (smallest). The infinity norm of Ωε (||Ωε||∞) provides an intermediate error estimate. This type of visualization is useful for comparing the performance and accuracy of different error estimation methods. The fact that the error bounds are centered around (0,0) suggests that the true value or equilibrium point of the system is at the origin.