\n
## Violin Plot: High School CS Accuracy
### Overview
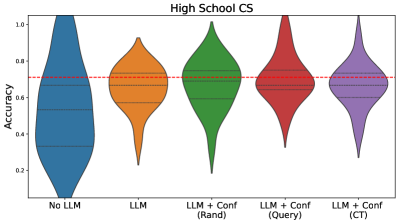
The image presents a violin plot comparing the accuracy scores for different approaches to a High School Computer Science (CS) task. The approaches are: "No LLM", "LLM", "LLM + Conf (Rand)", "LLM + Conf (Query)", and "LLM + Conf (CT)". A horizontal dashed red line indicates a benchmark accuracy level.
### Components/Axes
* **X-axis:** Categorical, representing the different approaches: "No LLM", "LLM", "LLM + Conf (Rand)", "LLM + Conf (Query)", "LLM + Conf (CT)".
* **Y-axis:** Numerical, labeled "Accuracy", with a scale ranging from approximately 0.2 to 1.0, incrementing by 0.2.
* **Violin Plots:** Each approach is represented by a violin plot, showing the distribution of accuracy scores.
* **Horizontal Dashed Line:** A red dashed horizontal line is present at approximately y = 0.65, likely representing a threshold or baseline accuracy.
### Detailed Analysis
The violin plots show the distribution of accuracy scores for each approach.
* **No LLM (Blue):** The violin plot is centered around approximately 0.55, with a wide distribution ranging from approximately 0.2 to 1.0. The plot is relatively broad, indicating significant variability in accuracy.
* **LLM (Orange):** The violin plot is centered around approximately 0.6, with a distribution ranging from approximately 0.3 to 0.9. It is narrower than the "No LLM" plot, suggesting less variability.
* **LLM + Conf (Rand) (Green):** The violin plot is centered around approximately 0.7, with a distribution ranging from approximately 0.4 to 1.0. It appears slightly wider than the "LLM" plot.
* **LLM + Conf (Query) (Red):** The violin plot is centered around approximately 0.65, with a distribution ranging from approximately 0.3 to 0.9. It is similar in shape to the "LLM" plot.
* **LLM + Conf (CT) (Purple):** The violin plot is centered around approximately 0.7, with a distribution ranging from approximately 0.4 to 1.0. It is similar in shape to the "LLM + Conf (Rand)" plot.
The red dashed line at approximately 0.65 serves as a visual benchmark. The "LLM + Conf (Rand)" and "LLM + Conf (CT)" approaches show a higher proportion of scores above this line compared to the other approaches.
### Key Observations
* The "No LLM" approach has the widest distribution of accuracy scores, indicating the most variability.
* The "LLM" approach shows an improvement in accuracy compared to "No LLM", with a narrower distribution.
* Adding confidence information ("LLM + Conf") generally improves accuracy, particularly with the "Rand" and "CT" methods.
* The "LLM + Conf (Rand)" and "LLM + Conf (CT)" approaches have the highest median accuracy and a significant portion of scores above the 0.65 benchmark.
### Interpretation
The data suggests that incorporating Large Language Models (LLMs) improves accuracy on the High School CS task compared to not using an LLM. Furthermore, adding confidence information to the LLM-based approaches ("LLM + Conf") further enhances performance. The "Rand" and "CT" methods for incorporating confidence appear to be particularly effective.
The violin plots reveal the distribution of accuracy scores, providing insights into the consistency of each approach. The wider distribution for "No LLM" indicates that performance is more variable without the assistance of an LLM. The narrower distributions for the LLM-based approaches suggest more consistent results.
The horizontal dashed line likely represents a target accuracy or a baseline performance level. The fact that "LLM + Conf (Rand)" and "LLM + Conf (CT)" have a larger proportion of scores above this line indicates that these approaches are more likely to meet or exceed the desired performance threshold.
The differences between the "Rand", "Query", and "CT" confidence methods are subtle but potentially meaningful. Further investigation would be needed to determine which method is most effective and why.