## Flowchart: Knowledge Graph Query Processing Workflow
### Overview
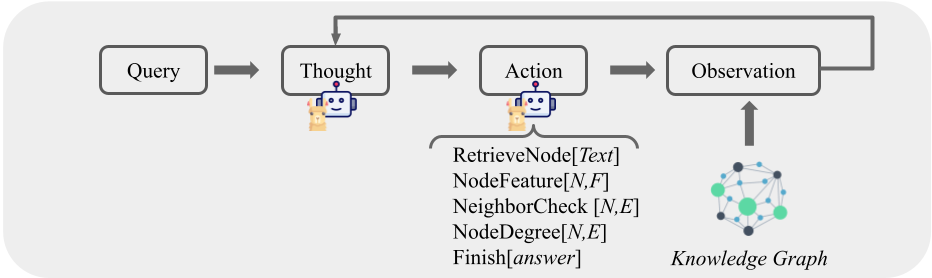
The image depicts a cyclical workflow for processing queries using a knowledge graph. It consists of four interconnected stages: **Query**, **Thought**, **Action**, and **Observation**, with feedback loops between stages. Key elements include robotic icons, a knowledge graph visualization, and action-specific operations.
### Components/Axes
1. **Stages**:
- **Query**: Text box labeled "Query" (top-left).
- **Thought**: Text box labeled "Thought" with a robot icon (🤖) and a dog icon (🐶) (center-left).
- **Action**: Text box labeled "Action" with a robot icon (🤖) and a dropdown list of operations (center-right).
- **Observation**: Text box labeled "Observation" with a robot icon (🤖) and a knowledge graph visualization (bottom-right).
2. **Knowledge Graph**:
- Nodes: Colored in green (primary), blue (secondary), and gray (tertiary).
- Edges: Connect nodes with varying line weights.
- Positioned in the "Observation" box.
3. **Action Operations**:
- Dropdown list includes:
- `RetrieveNode[Text]`
- `NodeFeature[N,F]`
- `NeighborCheck[N,E]`
- `NodeDegree[N,E]`
- `Finish[answer]`
### Detailed Analysis
- **Flow Direction**:
- Arrows connect stages sequentially: `Query → Thought → Action → Observation → Thought` (loop).
- Feedback loop from "Observation" back to "Thought" suggests iterative refinement.
- **Textual Elements**:
- All labels are in English. No non-English text detected.
- Action operations use bracketed parameters (e.g., `[N,F]` for node features).
- **Visual Elements**:
- Robot icons (🤖) appear in "Thought" and "Action" stages, symbolizing AI processing.
- Dog icon (🐶) in "Thought" may represent user/system interaction.
- Knowledge graph nodes/edges use distinct colors for categorization.
### Key Observations
1. **Iterative Process**: The loop from "Observation" to "Thought" implies continuous refinement of queries based on retrieved data.
2. **Action Specificity**: The dropdown operations suggest granular control over knowledge graph interactions (e.g., retrieving node features, checking neighbors).
3. **Knowledge Graph Structure**: Colored nodes and edges indicate hierarchical or categorical relationships within the graph.
### Interpretation
This workflow illustrates a closed-loop system for query resolution using a knowledge graph. The "Thought" stage likely involves AI-driven analysis (robot icon), while the "Action" stage executes specific graph operations. The knowledge graph visualization in "Observation" provides structured data for feedback, enabling the system to refine its approach iteratively. The inclusion of a dog icon in "Thought" may symbolize user/system collaboration or contextual awareness.
**Critical Note**: The absence of numerical data or explicit trends suggests this is a conceptual workflow rather than a data-driven analysis. The focus is on process design and component interactions.