\n
## Chart: Cross Section vs. Center of Mass Energy
### Overview
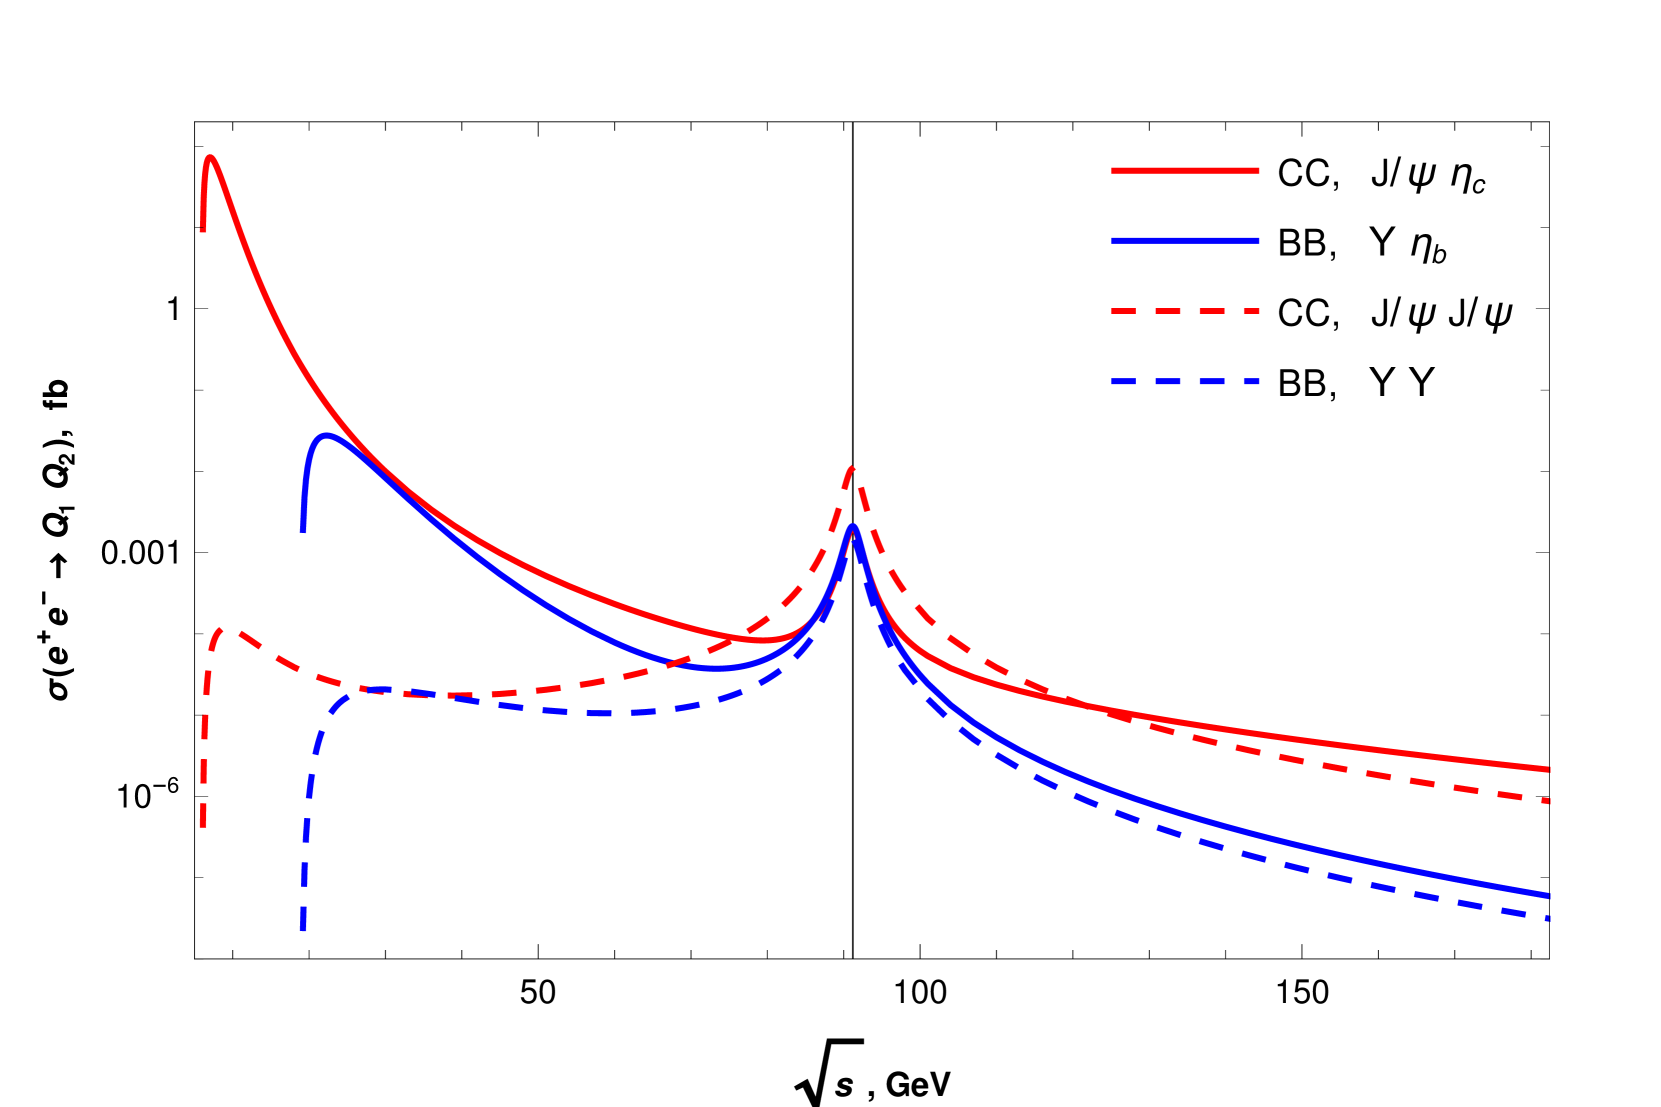
The image presents a chart depicting the cross section (σ) of electron-positron (e⁺e⁻) collisions as a function of the center of mass energy (√s). Four different collision scenarios are plotted, each represented by a distinct line style and color. The y-axis is on a logarithmic scale.
### Components/Axes
* **X-axis:** √s, GeV (Center of Mass Energy in GeV) - ranges from approximately 0 to 180 GeV.
* **Y-axis:** σ(e⁺e⁻ → Q₁Q₂, fb (Cross Section in femtobarns) - logarithmic scale, ranging from approximately 10⁻⁶ to 1.2 fb.
* **Legend:** Located in the top-right corner.
* Red Solid Line: CC, J/ψ ηc
* Blue Solid Line: BB, γ ηb
* Red Dashed Line: CC, J/ψ J/ψ
* Blue Dashed Line: BB, γ γ
### Detailed Analysis
The chart displays four curves representing different particle production scenarios.
* **Red Solid Line (CC, J/ψ ηc):** This line starts at approximately 1.2 fb at √s ≈ 0 GeV, rapidly decreasing to approximately 0.01 fb at √s ≈ 60 GeV. It then continues to decrease, leveling off around 10⁻⁵ fb at √s ≈ 180 GeV. There is a sharp peak at the beginning of the curve.
* **Blue Solid Line (BB, γ ηb):** This line exhibits a peak around √s ≈ 10 GeV, reaching a maximum cross section of approximately 0.003 fb. It then decreases to approximately 10⁻⁶ fb at √s ≈ 180 GeV.
* **Red Dashed Line (CC, J/ψ J/ψ):** This line starts at approximately 10⁻⁵ fb at √s ≈ 0 GeV, rises to a peak of approximately 0.0015 fb at √s ≈ 95 GeV, and then decreases to approximately 5x10⁻⁶ fb at √s ≈ 180 GeV.
* **Blue Dashed Line (BB, γ γ):** This line starts at approximately 10⁻⁵ fb at √s ≈ 0 GeV, rises to a peak of approximately 0.001 fb at √s ≈ 90 GeV, and then decreases to approximately 2x10⁻⁶ fb at √s ≈ 180 GeV.
### Key Observations
* The CC, J/ψ ηc channel has the highest cross section at low energies.
* The BB, γ ηb channel exhibits a peak at lower energies compared to the other channels.
* The CC, J/ψ J/ψ and BB, γ γ channels show similar behavior, with peaks around √s ≈ 90-95 GeV.
* All channels exhibit decreasing cross sections at higher energies.
* The y-axis is logarithmic, emphasizing the differences in cross sections across different energy ranges.
### Interpretation
This chart likely represents theoretical predictions or experimental measurements of the cross sections for producing various particle combinations (J/ψ ηc, γ ηb, J/ψ J/ψ, γ γ) in electron-positron collisions. The peaks in the curves correspond to resonance energies where the production of these particles is enhanced. The decreasing cross sections at higher energies are consistent with the expected behavior of quantum field theory, where the probability of particle production decreases with increasing energy.
The differences in the shapes and magnitudes of the curves provide insights into the underlying dynamics of the interactions. For example, the higher cross section for the CC, J/ψ ηc channel at low energies suggests a stronger coupling or a more favorable phase space for this process. The peaks around 90-95 GeV for the CC, J/ψ J/ψ and BB, γ γ channels indicate the presence of resonances at those energies, potentially corresponding to new particles or excited states.
The logarithmic scale on the y-axis is crucial for visualizing the wide range of cross sections involved. Without it, the lower cross sections would be difficult to discern. The chart is a valuable tool for understanding the production mechanisms of these particles and for testing the predictions of theoretical models.