## Line Chart: Evaluation Steps vs. Epoch for Individual and Lifelong Training
### Overview
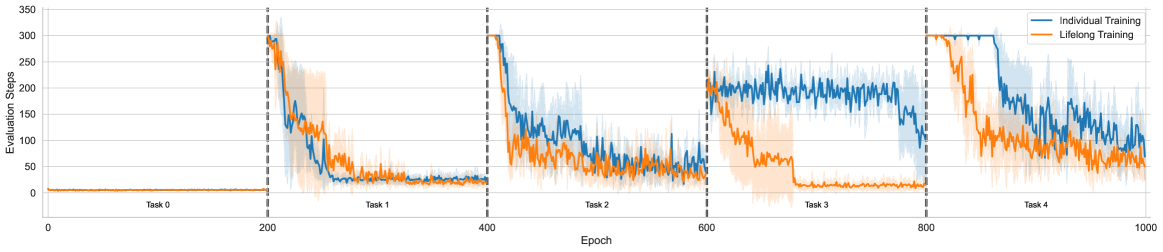
The image is a line chart comparing the performance of "Individual Training" and "Lifelong Training" across multiple tasks (Task 0 to Task 4). The chart plots "Evaluation Steps" (y-axis) against "Epoch" (x-axis). The performance is shown over 1000 epochs, with vertical dashed lines indicating the transition between tasks. Shaded regions around the lines represent the uncertainty or variance in the data.
### Components/Axes
* **X-axis:** Epoch, ranging from 0 to 1000. Markers are present at 0, 200, 400, 600, 800, and 1000.
* **Y-axis:** Evaluation Steps, ranging from 0 to 350. Markers are present at 0, 50, 100, 150, 200, 250, 300, and 350.
* **Legend (Top-Right):**
* Blue line: Individual Training
* Orange line: Lifelong Training
* **Vertical Dashed Lines:** Indicate the start of a new task. These lines are located at approximately Epoch 200, 400, 600, and 800.
* **Task Labels:** "Task 0", "Task 1", "Task 2", "Task 3", "Task 4" are positioned below the x-axis, centered between the vertical dashed lines.
### Detailed Analysis
**Task 0 (Epoch 0-200):**
* **Individual Training (Blue):** Stays relatively constant at a low value, approximately 5-10 Evaluation Steps.
* **Lifelong Training (Orange):** Stays relatively constant at a low value, approximately 5-10 Evaluation Steps.
**Task 1 (Epoch 200-400):**
* **Individual Training (Blue):** Starts at approximately 300 Evaluation Steps and decreases rapidly to approximately 25-50 Evaluation Steps.
* **Lifelong Training (Orange):** Starts at approximately 300 Evaluation Steps and decreases rapidly to approximately 25-50 Evaluation Steps.
**Task 2 (Epoch 400-600):**
* **Individual Training (Blue):** Fluctuates between approximately 50 and 150 Evaluation Steps.
* **Lifelong Training (Orange):** Fluctuates between approximately 25 and 75 Evaluation Steps.
**Task 3 (Epoch 600-800):**
* **Individual Training (Blue):** Starts at approximately 250 Evaluation Steps and increases to approximately 300 Evaluation Steps.
* **Lifelong Training (Orange):** Starts at approximately 150 Evaluation Steps and decreases rapidly to approximately 25 Evaluation Steps.
**Task 4 (Epoch 800-1000):**
* **Individual Training (Blue):** Starts at approximately 300 Evaluation Steps and decreases to approximately 100-200 Evaluation Steps.
* **Lifelong Training (Orange):** Starts at approximately 150 Evaluation Steps and decreases to approximately 50-100 Evaluation Steps.
### Key Observations
* Both Individual and Lifelong Training perform similarly on Task 0, with very low Evaluation Steps.
* Both training methods experience a significant drop in Evaluation Steps when transitioning to Task 1.
* Lifelong Training generally has lower Evaluation Steps than Individual Training, especially in later tasks.
* The variance (shaded region) is generally larger for Individual Training than for Lifelong Training.
### Interpretation
The chart suggests that Lifelong Training adapts more effectively to new tasks compared to Individual Training. While both methods initially struggle with Task 1, Lifelong Training consistently achieves lower Evaluation Steps in subsequent tasks, indicating better performance. The larger variance in Individual Training suggests that its performance is less stable and more sensitive to the specific task. The initial low performance on Task 0 indicates a period of initial learning or exploration for both methods. The sharp drops at the beginning of each new task suggest that both training methods need to re-learn or adapt to the new task environment.