## Scatter Plot: Confidence vs. Target Length (High School Computer Science)
### Overview
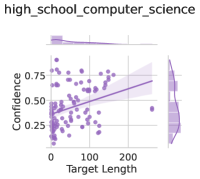
This image presents a scatter plot visualizing the relationship between "Target Length" and "Confidence" for data labeled as "high_school_computer_science". A regression line and shaded confidence interval are overlaid on the scatter points. The plot also includes marginal distributions (histograms) along the top and right edges, showing the distributions of Target Length and Confidence, respectively.
### Components/Axes
* **X-axis:** "Target Length" - Scale ranges from approximately 0 to 250.
* **Y-axis:** "Confidence" - Scale ranges from approximately 0.2 to 0.8.
* **Scatter Points:** Purple dots representing individual data points.
* **Regression Line:** A purple line representing the trend of the data. The line slopes upwards.
* **Confidence Interval:** A shaded purple area around the regression line, indicating the uncertainty in the estimated trend.
* **Top Marginal Distribution:** A histogram showing the distribution of "Target Length".
* **Right Marginal Distribution:** A histogram showing the distribution of "Confidence".
* **Title:** "high\_school\_computer\_science" - positioned at the top-left of the image.
### Detailed Analysis
The scatter plot shows a generally positive correlation between "Target Length" and "Confidence". As "Target Length" increases, "Confidence" tends to increase, although the relationship is not perfectly linear and has significant scatter.
* **Regression Line Trend:** The regression line slopes upwards, indicating a positive correlation.
* **Scatter Point Distribution:** The majority of data points are clustered around the lower left corner of the plot (low "Target Length", low "Confidence"). There is a spread of points towards higher "Confidence" values as "Target Length" increases.
* **Outlier:** There is one data point at approximately (220, 0.3) that lies significantly below the regression line and the general trend.
* **Top Marginal Distribution (Target Length):** The distribution of "Target Length" is skewed to the right, with a higher concentration of values near 0 and a tail extending towards higher values.
* **Right Marginal Distribution (Confidence):** The distribution of "Confidence" appears to be roughly uniform between 0.2 and 0.8, with a slight concentration of values between 0.5 and 0.7.
Approximate Data Points (based on visual estimation):
* (0, 0.25): Confidence is approximately 0.25 when Target Length is 0.
* (0, 0.6): Confidence is approximately 0.6 when Target Length is 0.
* (50, 0.4): Confidence is approximately 0.4 when Target Length is 50.
* (50, 0.7): Confidence is approximately 0.7 when Target Length is 50.
* (100, 0.55): Confidence is approximately 0.55 when Target Length is 100.
* (100, 0.75): Confidence is approximately 0.75 when Target Length is 100.
* (200, 0.65): Confidence is approximately 0.65 when Target Length is 200.
* (220, 0.3): Outlier with low confidence.
### Key Observations
* A positive, but weak, correlation exists between "Target Length" and "Confidence".
* The data exhibits significant variability, suggesting that "Target Length" is not a strong predictor of "Confidence".
* The outlier at (220, 0.3) deviates significantly from the overall trend.
* The marginal distributions provide insights into the individual distributions of "Target Length" and "Confidence".
### Interpretation
The data suggests that, for "high_school_computer_science" tasks, there is a tendency for confidence to increase with the length of the target, but this relationship is not strong. The large spread of data points indicates that other factors likely influence confidence levels. The outlier suggests that there are cases where even relatively long targets result in low confidence, potentially due to task complexity or individual student performance. The right-skewed distribution of "Target Length" indicates that most tasks have relatively short targets, while the relatively uniform distribution of "Confidence" suggests that confidence levels are more evenly distributed across the range. The marginal distributions provide additional context for interpreting the scatter plot and understanding the characteristics of the data. The regression line and confidence interval provide a statistical summary of the relationship between the two variables, but the significant scatter highlights the limitations of this model.