## Flowchart: Hypotheses for Jenny's Messy House
### Overview
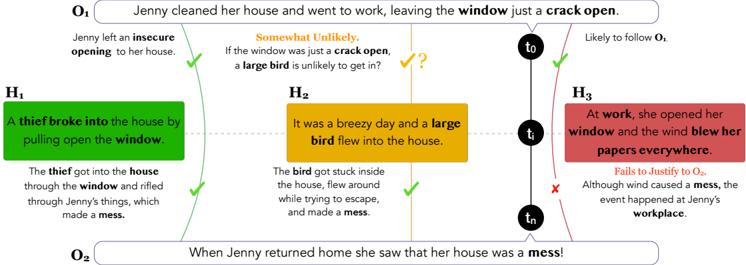
The flowchart illustrates three competing hypotheses (H1, H2, H3) explaining why Jenny's house was a mess when she returned home. It uses color-coded boxes, directional arrows, and symbolic markers (✓, ✗, ?) to represent causal relationships, likelihood assessments, and logical validity. The narrative spans three time points: t₀ (initial observation), tᵢ (intermediate event), and tₙ (final conclusion).
---
### Components/Axes
- **Hypotheses (H1-H3)**: Three colored boxes (green, yellow, red) representing distinct scenarios.
- **Outcomes (O1, O2)**: Two text nodes describing the initial and final states of the house.
- **Timeline Markers**: t₀ (top), tᵢ (middle), tₙ (bottom) anchoring the narrative flow.
- **Legend**:
- Green ✓ = Likely causal link
- Yellow ? = Uncertainty
- Red ✗ = Invalid causal link
- Orange = Neutral/transitional state
---
### Detailed Analysis
#### Hypothesis H1 (Green)
- **Label**: "A thief broke into the house by pulling open the window."
- **Supporting Text**:
- "The thief got into the house through the window and rifled through Jenny’s things, which made a mess."
- **Connections**:
- Direct arrow from O₁ (initial observation) with ✓ (likely).
- Arrow to O₂ (final conclusion) with ✓ (likely).
#### Hypothesis H2 (Yellow)
- **Label**: "It was a breezy day and a large bird flew into the house."
- **Supporting Text**:
- "The bird got stuck inside the house, flew around while trying to escape, and made a mess."
- **Connections**:
- Arrow from O₁ with ✓ (likely).
- Arrow to O₂ with ✓ (likely).
- Intermediate question mark (?) questioning plausibility of a "large bird" entering through a "crack open" window.
#### Hypothesis H3 (Red)
- **Label**: "At work, she opened her window and the wind blew her papers everywhere."
- **Supporting Text**:
- "Fails to justify O₂. Although wind caused a mess, the event happened at Jenny’s workplace."
- **Connections**:
- Arrow from tᵢ to O₂ with ✗ (invalid).
- Red color indicates logical inconsistency with O₂.
---
### Key Observations
1. **H1 and H2** are both marked as likely (✓) to explain O₂, but H1 is spatially prioritized (leftmost).
2. **H3** is explicitly rejected (✗) due to temporal mismatch (workplace vs. home).
3. **O1** serves as the premise for all hypotheses, while **O2** is the conclusion.
4. **tᵢ** acts as a pivot point separating H1/H2 (home-based causes) from H3 (workplace cause).
---
### Interpretation
The flowchart demonstrates abductive reasoning, where multiple hypotheses are tested against observed outcomes. H1 and H2 are plausible explanations for the mess, but H3 is dismissed because its causal mechanism (wind at work) cannot account for the state of Jenny’s *home*. The use of color and symbols creates a visual hierarchy: green (valid) hypotheses dominate, while red (invalid) hypotheses are marginalized. The question mark in H2 introduces uncertainty about the plausibility of a "large bird" entering through a small opening, suggesting potential gaps in the narrative. The timeline anchors the story in chronological order, emphasizing that the mess occurred *after* Jenny left for work (t₀) and before her return (tₙ).