## Heatmap: Output Token Position Index vs. Decoding Steps
### Overview
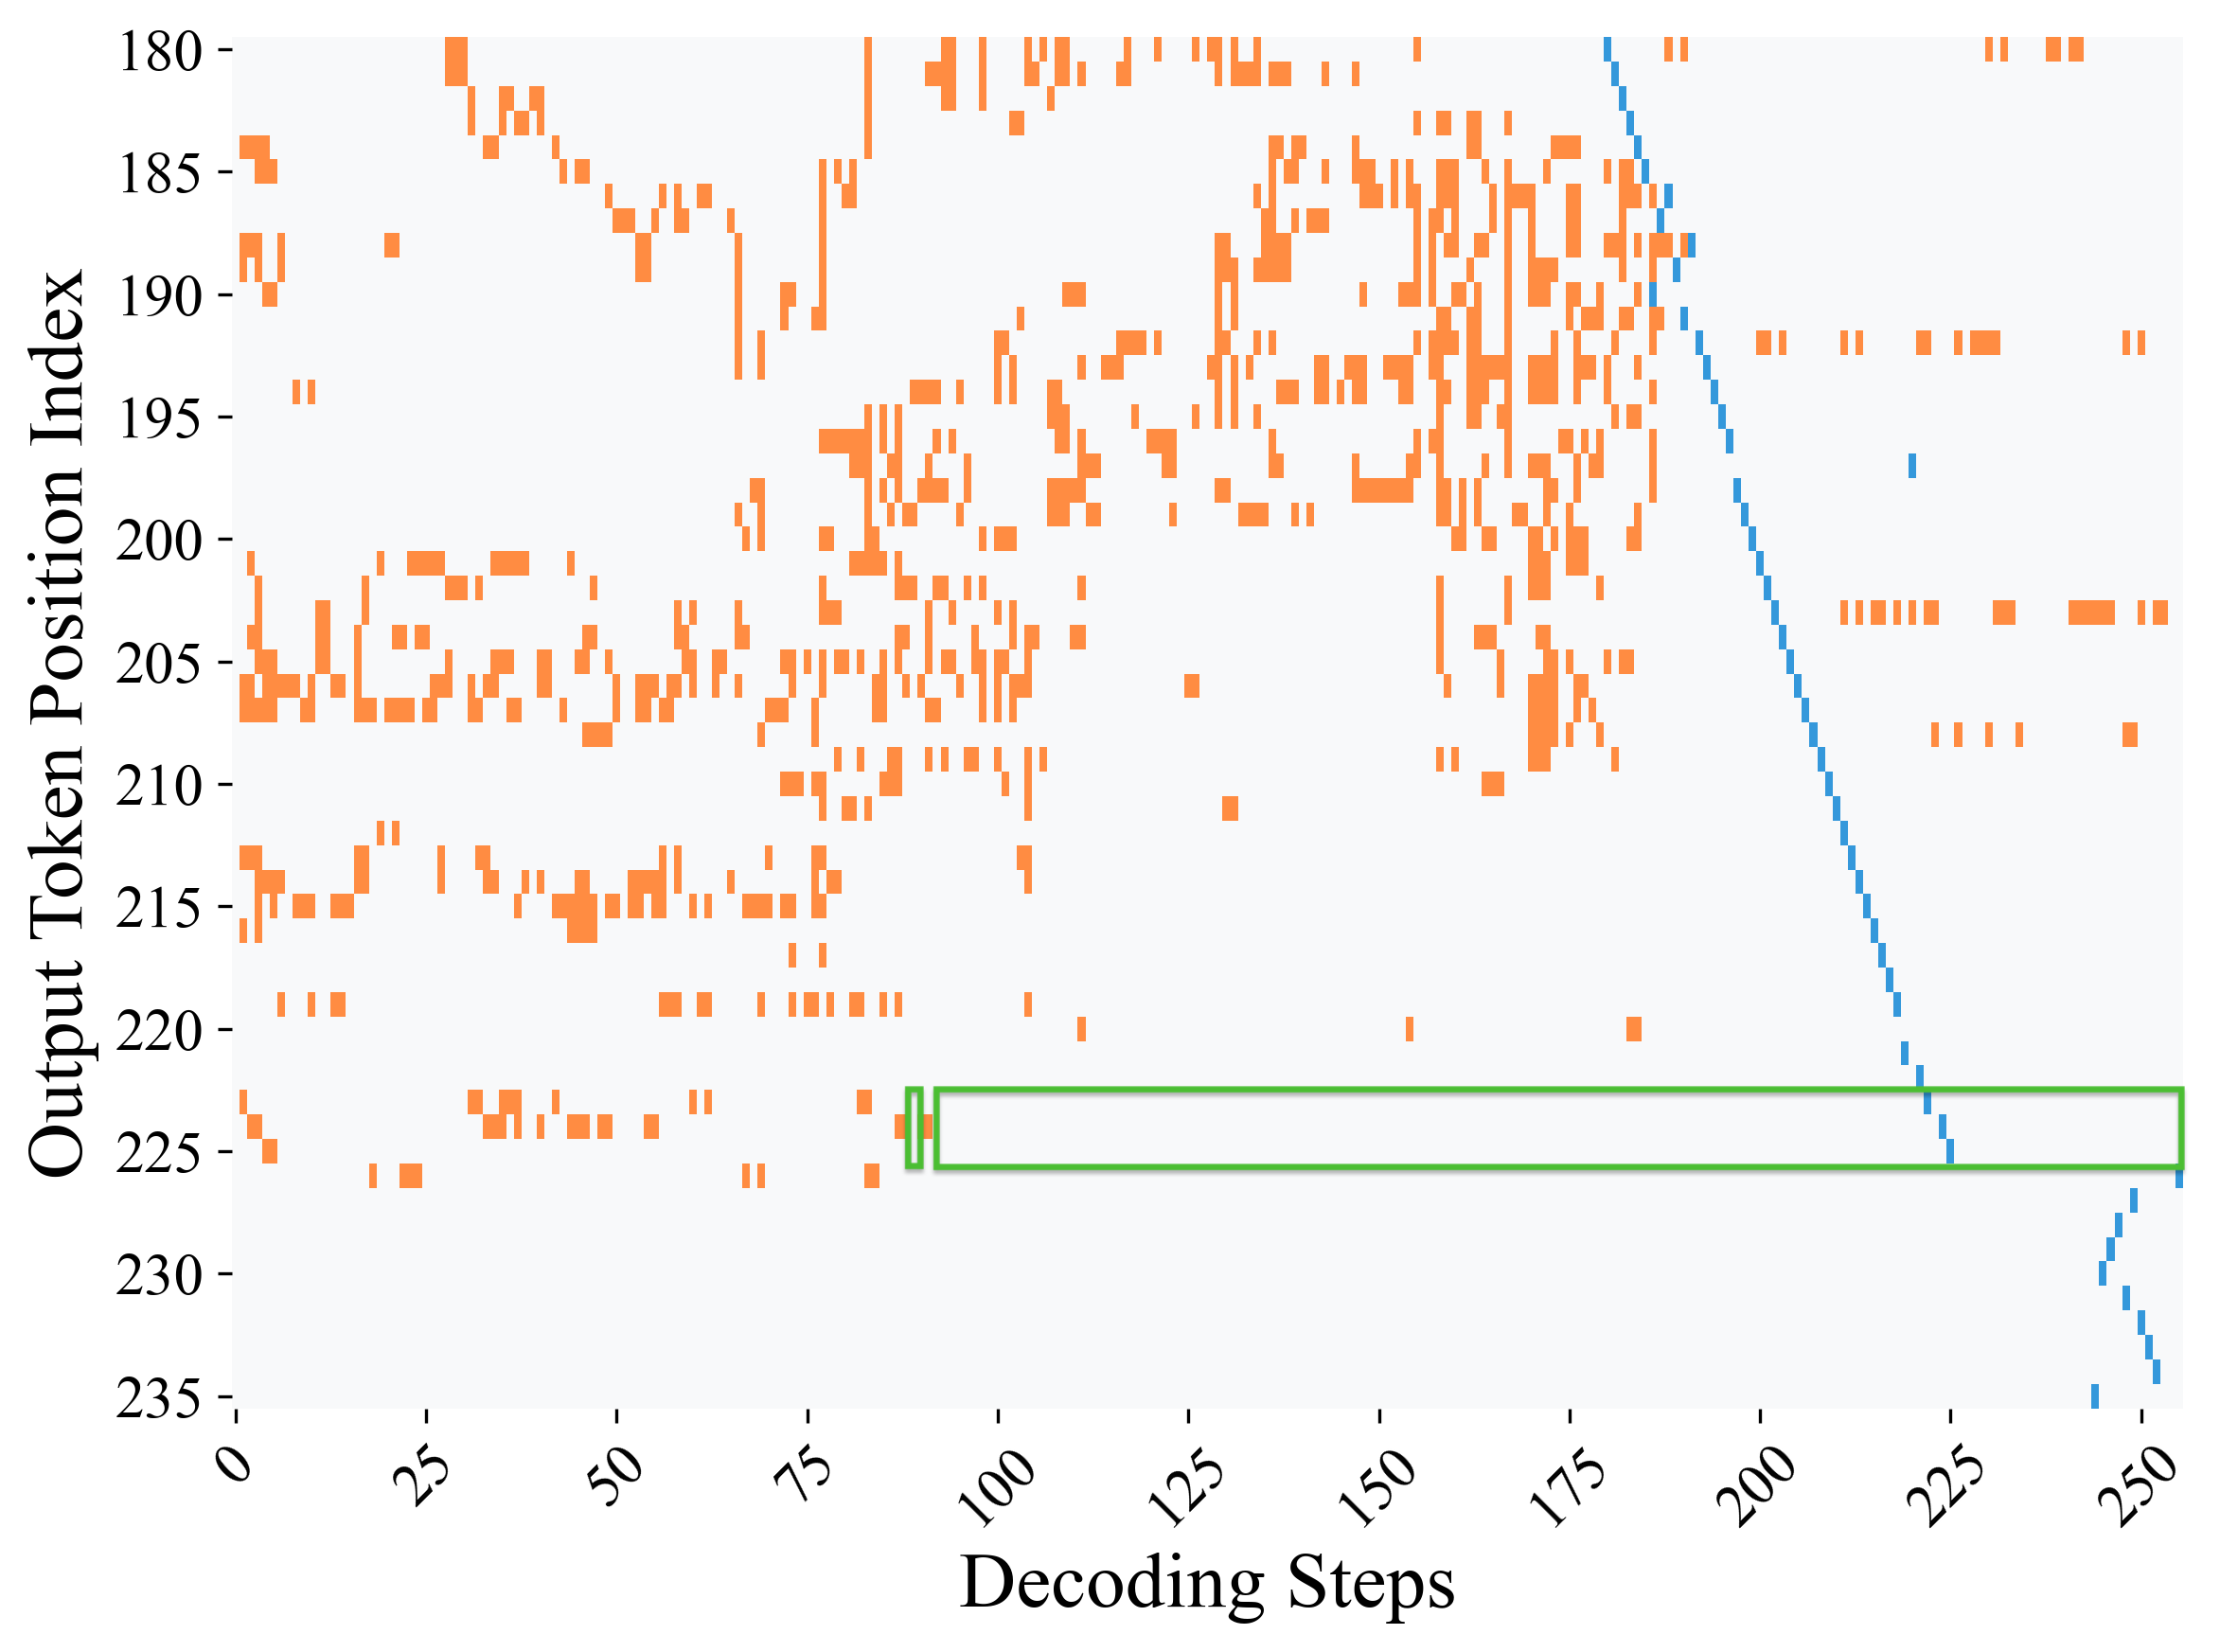
The image is a heatmap that visualizes the relationship between the output token position index and the decoding steps. The x-axis represents the decoding steps, ranging from 0 to 250. The y-axis represents the output token position index, ranging from 180 to 235. Orange blocks indicate the presence of a token at a specific position index during a specific decoding step. A blue line indicates a different type of event or state during decoding. A green rectangle highlights a specific region of interest.
### Components/Axes
* **X-axis:** Decoding Steps, ranging from 0 to 250, with markers at 0, 25, 50, 75, 100, 125, 150, 175, 200, 225, and 250.
* **Y-axis:** Output Token Position Index, ranging from 180 to 235, with markers at 180, 185, 190, 195, 200, 205, 210, 215, 220, 225, 230, and 235.
* **Data Points:**
* Orange blocks: Indicate the presence of a token at a specific position index during a specific decoding step.
* Blue line: A diagonal line starting from approximately (185, 180) and extending to approximately (250, 235).
* **Green Rectangle:** A rectangle spanning approximately from decoding steps 90 to 250 and output token position index 222 to 227.
### Detailed Analysis or ### Content Details
* **Orange Blocks:**
* The orange blocks are scattered throughout the heatmap, primarily concentrated in the upper-left region (decoding steps 0-175, output token position index 180-225).
* The density of orange blocks decreases as the decoding steps increase beyond 175.
* There are relatively few orange blocks below the output token position index of 225.
* **Blue Line:**
* The blue line starts at approximately decoding step 185 and output token position index 180.
* The blue line slopes downward and to the right, reaching approximately decoding step 250 and output token position index 235.
* The blue line appears to be composed of individual vertical blue lines.
* **Green Rectangle:**
* The green rectangle spans from approximately decoding step 90 to 250 and output token position index 222 to 227.
* The green rectangle highlights a specific region of interest, potentially indicating a particular state or event during decoding.
### Key Observations
* The orange blocks are more concentrated in the earlier decoding steps (0-175), suggesting that tokens are primarily generated during this phase.
* The blue line indicates a distinct event or state that occurs later in the decoding process (decoding steps 185-250).
* The green rectangle highlights a specific region of interest, potentially indicating a particular state or event during decoding.
### Interpretation
The heatmap visualizes the decoding process, showing the relationship between the output token position index and the decoding steps. The orange blocks represent the generation of tokens, which are more frequent in the earlier decoding steps. The blue line may represent a transition or completion phase of the decoding process. The green rectangle highlights a specific region of interest, potentially indicating a particular state or event during decoding, such as a stabilization or convergence point in the decoding process. The data suggests that the decoding process involves an initial phase of token generation followed by a transition or completion phase.