\n
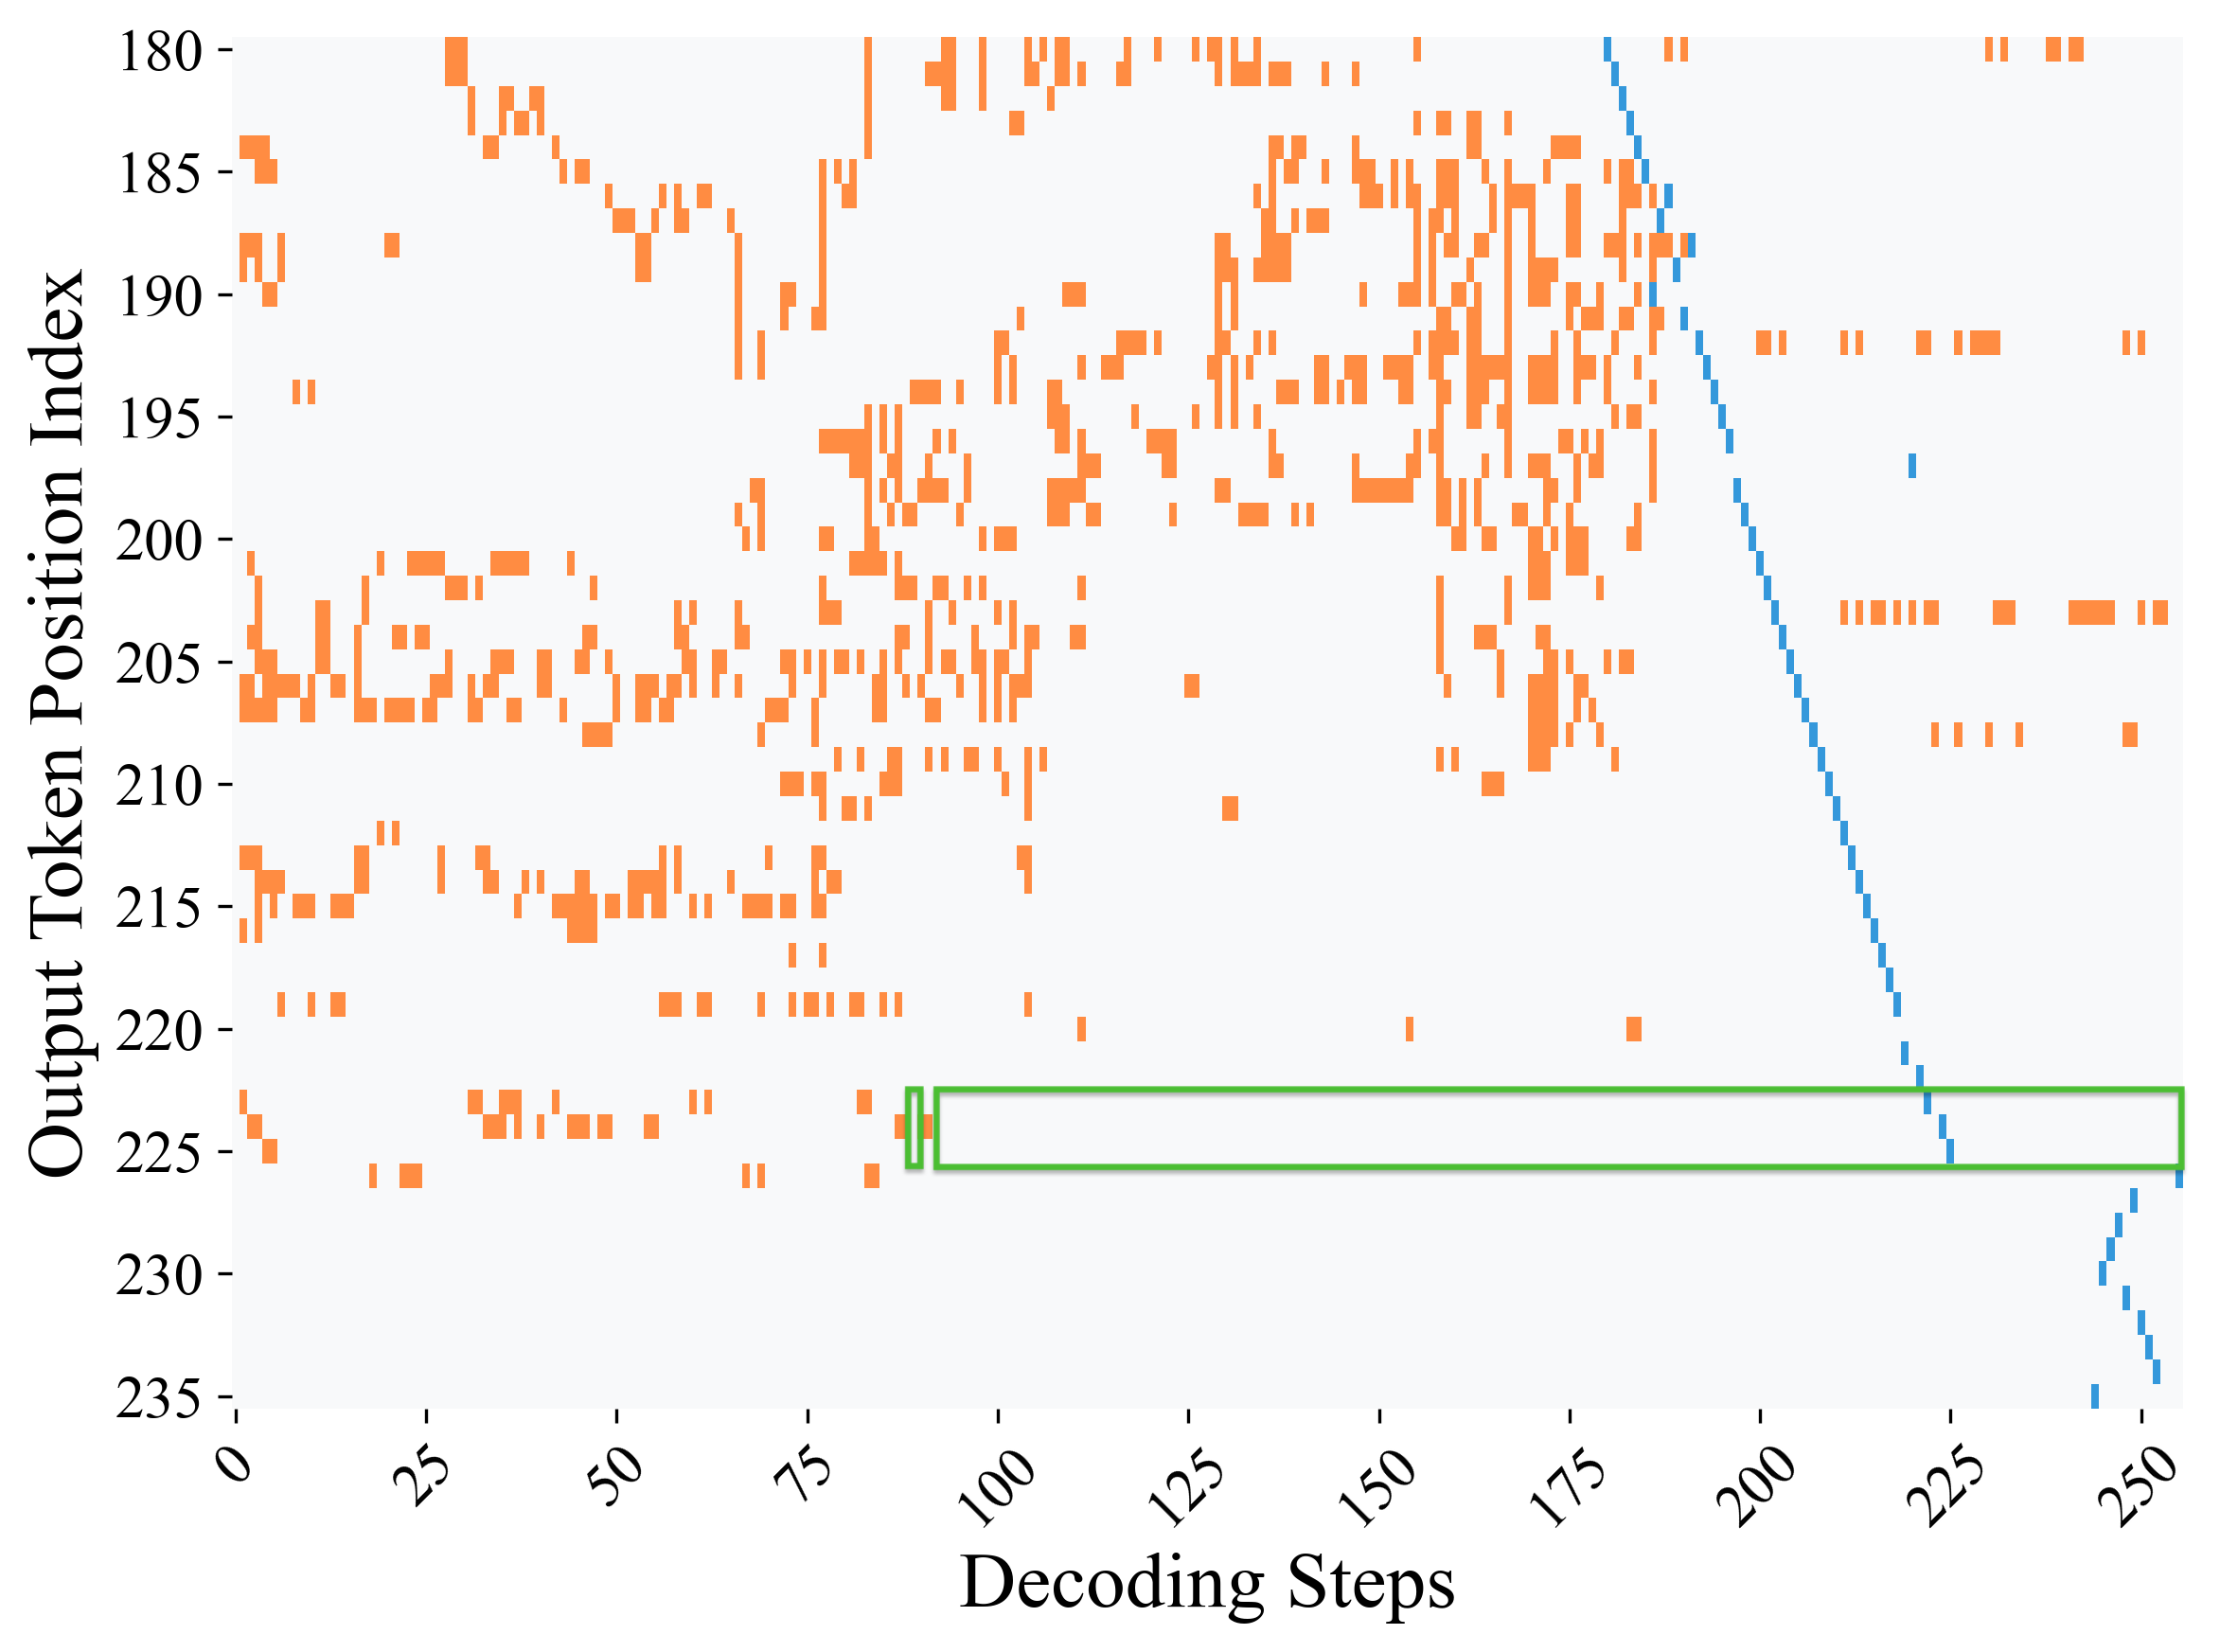
## Scatter Plot: Decoding Steps vs. Output Token Position
### Overview
The image presents a scatter plot visualizing the relationship between "Decoding Steps" and "Output Token Position". The plot displays a dense collection of orange data points, a green horizontal line, and a blue line that slopes downward towards the right side of the chart. The plot appears to represent the progression of a decoding process, potentially in a language model or similar system.
### Components/Axes
* **X-axis:** "Decoding Steps" - Ranging from 0 to 250, with tick marks at intervals of 25.
* **Y-axis:** "Output Token Position" - Ranging from 180 to 235, with tick marks at intervals of 5.
* **Data Points:** Orange squares, densely scattered throughout the plot area.
* **Green Line:** A horizontal line positioned approximately at Output Token Position 225.
* **Blue Line:** A line starting around Decoding Step 200 and sloping downwards, ending around Decoding Step 250.
### Detailed Analysis
The orange data points are distributed across the entire plot area, but are more concentrated in the upper portion (higher Output Token Positions) at lower Decoding Steps. As Decoding Steps increase, the density of orange points decreases, and they become more concentrated towards the lower portion of the plot.
* **Orange Data Points:** The points are scattered, making precise value extraction difficult. However, we can observe approximate ranges:
* From Decoding Step 0 to 50: Output Token Positions range from approximately 180 to 215.
* From Decoding Step 50 to 150: Output Token Positions range from approximately 190 to 220.
* From Decoding Step 150 to 250: Output Token Positions range from approximately 200 to 230, with a decreasing density.
* **Green Line:** The green line is a horizontal band, indicating a constant Output Token Position of approximately 225, spanning from approximately Decoding Step 75 to 225.
* **Blue Line:** The blue line exhibits a clear downward trend.
* At Decoding Step 200, the Output Token Position is approximately 195.
* At Decoding Step 225, the Output Token Position is approximately 220.
* At Decoding Step 250, the Output Token Position is approximately 230.
### Key Observations
* The density of orange data points decreases as Decoding Steps increase, suggesting a reduction in activity or the completion of a process.
* The green line represents a stable state or a threshold in the Output Token Position.
* The downward slope of the blue line indicates a change in the relationship between Decoding Steps and Output Token Position, potentially representing a finalization or convergence phase.
* There is a clear separation between the orange points and the green line, suggesting that the majority of the decoding process occurs at Output Token Positions above 225.
### Interpretation
This plot likely represents the decoding process of a sequence generation model (e.g., a language model). The "Decoding Steps" represent the iterations or steps taken to generate the output sequence, while the "Output Token Position" indicates the position of the generated token within the sequence.
The initial dense scattering of orange points suggests a period of exploration and uncertainty in the decoding process. As the decoding progresses (increasing Decoding Steps), the model converges towards a more stable state, as indicated by the decreasing density of points and the emergence of the green line. The green line could represent a point where the model has reached a certain level of confidence or has completed a significant portion of the sequence generation.
The blue line's downward trend suggests a finalization phase where the model is refining the output sequence or completing the generation process. The decreasing Output Token Position could indicate that the model is reaching the end of the sequence.
The plot suggests a successful decoding process that converges towards a stable output sequence. The absence of any significant outliers or anomalies indicates a smooth and predictable generation process. The data suggests that the model is actively generating tokens up to a certain point (around Decoding Step 200), after which it enters a refinement or finalization phase.