## Line Chart: Accuracy vs. Step
### Overview
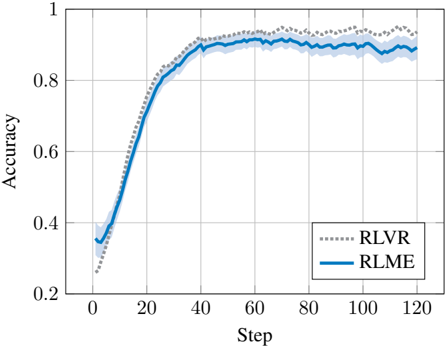
The image is a line chart comparing the accuracy of two models, RLVR (dotted gray line) and RLME (solid blue line), over a series of steps. The chart shows how the accuracy of each model changes as the number of steps increases. The blue line has a shaded region around it, indicating the variance or confidence interval.
### Components/Axes
* **X-axis:** "Step", with markers at 0, 20, 40, 60, 80, 100, and 120.
* **Y-axis:** "Accuracy", ranging from 0.2 to 1.0, with markers at 0.2, 0.4, 0.6, 0.8, and 1.
* **Legend:** Located in the bottom-right corner.
* RLVR: Represented by a dotted gray line.
* RLME: Represented by a solid blue line with a shaded blue region around it.
### Detailed Analysis
* **RLVR (Dotted Gray Line):**
* Trend: The accuracy increases sharply from approximately 0.3 at step 0 to around 0.9 at step 40. After step 40, the accuracy fluctuates slightly around 0.9.
* Data Points:
* Step 0: Accuracy ≈ 0.3
* Step 20: Accuracy ≈ 0.7
* Step 40: Accuracy ≈ 0.9
* Step 80: Accuracy ≈ 0.92
* Step 120: Accuracy ≈ 0.88
* **RLME (Solid Blue Line):**
* Trend: The accuracy increases sharply from approximately 0.35 at step 0 to around 0.85 at step 40. After step 40, the accuracy fluctuates slightly around 0.9. The shaded region indicates the variability in the accuracy.
* Data Points:
* Step 0: Accuracy ≈ 0.35
* Step 20: Accuracy ≈ 0.75
* Step 40: Accuracy ≈ 0.85
* Step 80: Accuracy ≈ 0.9
* Step 120: Accuracy ≈ 0.88
### Key Observations
* Both RLVR and RLME models show a significant increase in accuracy during the initial steps (0-40).
* After step 40, the accuracy of both models plateaus, with minor fluctuations.
* The RLME model has a shaded region, indicating the variance or confidence interval of its accuracy.
* The RLVR model appears to have slightly higher accuracy than the RLME model between steps 40 and 80.
### Interpretation
The chart demonstrates the learning curves of two models, RLVR and RLME, over a series of steps. Both models exhibit a rapid increase in accuracy initially, suggesting effective learning during the early stages. The plateauing of accuracy after step 40 indicates that the models have reached a point of diminishing returns, where further training yields minimal improvement. The shaded region around the RLME line suggests that its performance is more variable than RLVR. The RLVR model seems to perform slightly better than the RLME model after the initial learning phase.