## Chart: Microphone Frequency Response Comparison
### Overview
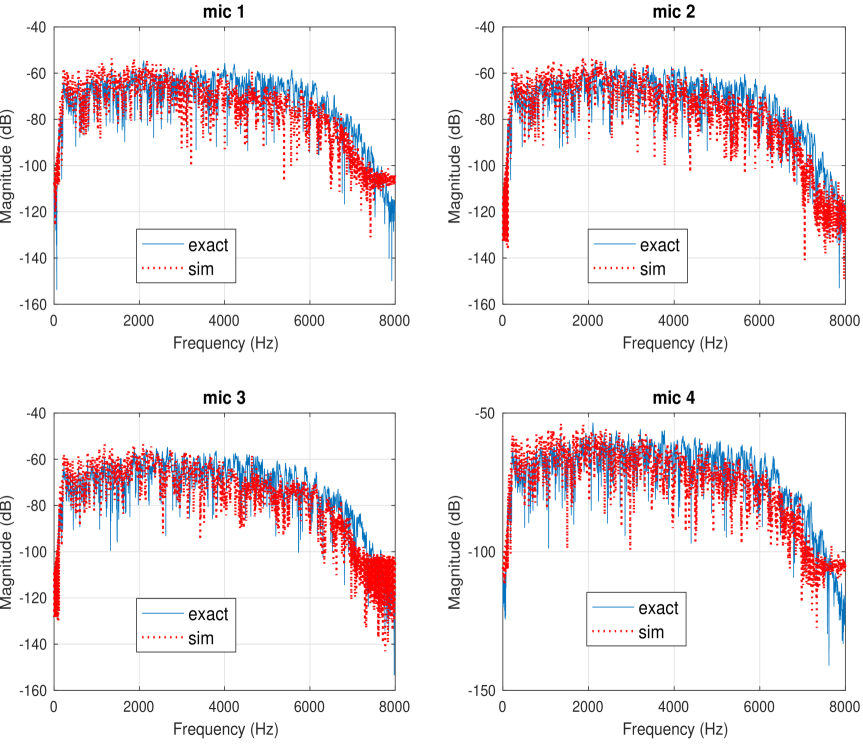
The image presents a 2x2 grid of charts, each displaying the frequency response of a different microphone (mic 1, mic 2, mic 3, and mic 4). Each chart compares the "exact" measured frequency response with a "sim"ulated response, plotted against frequency. The y-axis represents magnitude in decibels (dB), and the x-axis represents frequency in Hertz (Hz). All charts share the same scales.
### Components/Axes
* **X-axis:** Frequency (Hz), ranging from 0 to 8000 Hz.
* **Y-axis:** Magnitude (dB), ranging from -160 dB to -40 dB.
* **Legend:**
* "exact" - Represented by a solid blue line.
* "sim" - Represented by a dotted red line.
* **Titles:** Each subplot is labeled "mic 1", "mic 2", "mic 3", and "mic 4" respectively.
### Detailed Analysis or Content Details
**Mic 1 (Top-Left):**
The "exact" response (blue line) generally slopes downward from approximately -45 dB at 0 Hz to approximately -140 dB at 8000 Hz. There are several peaks and valleys along the curve. The "sim" response (red dotted line) is generally similar, but exhibits more pronounced peaks and valleys, and is slightly higher in magnitude across most frequencies.
* At 1000 Hz: exact ≈ -65 dB, sim ≈ -55 dB
* At 2000 Hz: exact ≈ -70 dB, sim ≈ -60 dB
* At 4000 Hz: exact ≈ -80 dB, sim ≈ -70 dB
* At 6000 Hz: exact ≈ -110 dB, sim ≈ -90 dB
* At 8000 Hz: exact ≈ -140 dB, sim ≈ -120 dB
**Mic 2 (Top-Right):**
The "exact" response (blue line) starts at approximately -40 dB at 0 Hz and decreases to approximately -130 dB at 8000 Hz. The "sim" response (red dotted line) is more erratic, with larger fluctuations in magnitude.
* At 1000 Hz: exact ≈ -60 dB, sim ≈ -50 dB
* At 2000 Hz: exact ≈ -70 dB, sim ≈ -60 dB
* At 4000 Hz: exact ≈ -85 dB, sim ≈ -75 dB
* At 6000 Hz: exact ≈ -110 dB, sim ≈ -90 dB
* At 8000 Hz: exact ≈ -130 dB, sim ≈ -110 dB
**Mic 3 (Bottom-Left):**
The "exact" response (blue line) begins at approximately -50 dB at 0 Hz and declines to approximately -150 dB at 8000 Hz. The "sim" response (red dotted line) is again more variable, with larger peaks and dips.
* At 1000 Hz: exact ≈ -60 dB, sim ≈ -50 dB
* At 2000 Hz: exact ≈ -70 dB, sim ≈ -60 dB
* At 4000 Hz: exact ≈ -85 dB, sim ≈ -75 dB
* At 6000 Hz: exact ≈ -115 dB, sim ≈ -95 dB
* At 8000 Hz: exact ≈ -150 dB, sim ≈ -130 dB
**Mic 4 (Bottom-Right):**
The "exact" response (blue line) starts at approximately -50 dB at 0 Hz and decreases to approximately -150 dB at 8000 Hz. The "sim" response (red dotted line) is similar to the others, showing more pronounced fluctuations.
* At 1000 Hz: exact ≈ -60 dB, sim ≈ -50 dB
* At 2000 Hz: exact ≈ -70 dB, sim ≈ -60 dB
* At 4000 Hz: exact ≈ -85 dB, sim ≈ -75 dB
* At 6000 Hz: exact ≈ -115 dB, sim ≈ -95 dB
* At 8000 Hz: exact ≈ -150 dB, sim ≈ -130 dB
### Key Observations
* The "sim"ulated responses consistently exhibit more pronounced peaks and valleys compared to the "exact" measurements across all microphones.
* The "sim"ulated responses generally have higher magnitudes than the "exact" responses, particularly at higher frequencies.
* All microphones show a general downward trend in magnitude as frequency increases.
* The differences between the "exact" and "sim" responses appear to be more significant at higher frequencies.
### Interpretation
The charts demonstrate a comparison between measured ("exact") and simulated ("sim") frequency responses for four different microphones. The consistent overestimation of magnitude by the simulation suggests that the simulation model may not fully capture the damping or other frequency-dependent characteristics of the microphones. The larger discrepancies at higher frequencies indicate that the simulation may be less accurate in modeling the behavior of the microphones in that range. This could be due to factors not included in the simulation, such as internal resonances or parasitic capacitances. The data suggests that while the simulation provides a reasonable approximation, it is not a perfect representation of the actual microphone performance. Further refinement of the simulation model may be necessary to improve its accuracy, particularly at higher frequencies. The consistent pattern across all four microphones suggests a systematic issue with the simulation rather than a microphone-specific problem.