\n
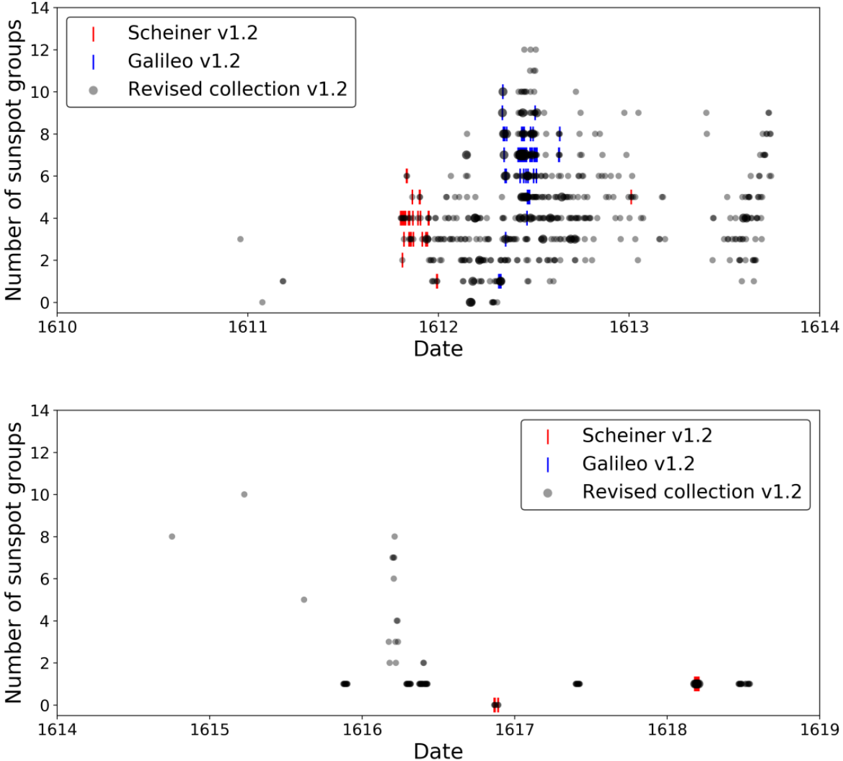
## Scatter Plot: Sunspot Group Observations (1610-1619)
### Overview
The image presents two scatter plots displaying the number of sunspot groups observed over time, from approximately 1610 to 1619. Three datasets are plotted: observations by Scheiner v1.2 (red), Galileo v1.2 (blue), and a revised collection v1.2 (gray). The plots aim to compare the sunspot observations made by these different observers.
### Components/Axes
* **X-axis:** Date, ranging from 1610 to 1619.
* **Y-axis:** Number of sunspot groups, ranging from 0 to 14.
* **Legend (Top-Right of each plot):**
* Scheiner v1.2 (represented by red vertical lines/markers)
* Galileo v1.2 (represented by blue vertical lines/markers)
* Revised collection v1.2 (represented by gray circles)
### Detailed Analysis or Content Details
**Plot 1 (1610-1614):**
* **Scheiner v1.2 (Red):** A cluster of observations between approximately 1611.5 and 1612.5, with the number of sunspot groups ranging from approximately 2 to 6. There is a slight upward trend initially, followed by a decrease.
* **Galileo v1.2 (Blue):** A dense cluster of observations between approximately 1612 and 1613, with the number of sunspot groups ranging from approximately 2 to 10. The data appears relatively scattered, with a peak around 8-10 sunspot groups.
* **Revised collection v1.2 (Gray):** Scattered observations throughout the period, with the number of sunspot groups ranging from approximately 0 to 10. There is a higher density of observations between 1612 and 1614, generally clustering between 2 and 6 sunspot groups.
**Plot 2 (1614-1619):**
* **Scheiner v1.2 (Red):** Very few observations. One observation at approximately 1616.8 with around 2 sunspot groups, and another at approximately 1617.5 with around 1 sunspot group.
* **Galileo v1.2 (Blue):** Very few observations. One observation at approximately 1616.8 with around 2 sunspot groups, and another at approximately 1617.5 with around 1 sunspot group.
* **Revised collection v1.2 (Gray):** Scattered observations between 1614 and 1616, ranging from approximately 0 to 8 sunspot groups. Observations become sparse after 1616, with a few points around 1-2 sunspot groups between 1617 and 1619.
### Key Observations
* The period between 1612 and 1613 shows the highest concentration of sunspot observations across all three datasets.
* There is a general agreement between the three datasets during the peak observation period (1612-1613), although there is some variation in the reported number of sunspot groups.
* Observations become significantly sparser after 1614, particularly for Scheiner and Galileo.
* The revised collection provides a more continuous record, even during periods of sparse observations from the other two sources.
### Interpretation
The data suggests a period of heightened sunspot activity around 1612-1613, as observed by all three researchers. The differences in reported numbers likely reflect variations in observational techniques, instrument quality, or subjective interpretation. The decline in observations after 1614 could be due to a genuine decrease in sunspot activity, or it could be a result of reduced observational effort by Scheiner and Galileo. The revised collection attempts to reconcile these observations, providing a more complete, though still incomplete, picture of sunspot activity during this period. The fact that all three observers generally agree during the peak period lends credibility to the existence of a significant solar event around 1612-1613. The sparse data after 1614 makes it difficult to draw firm conclusions about long-term trends.