## Line Graphs: Step-wise Loss vs. Tokens for Different Model Sizes and Time Steps
### Overview
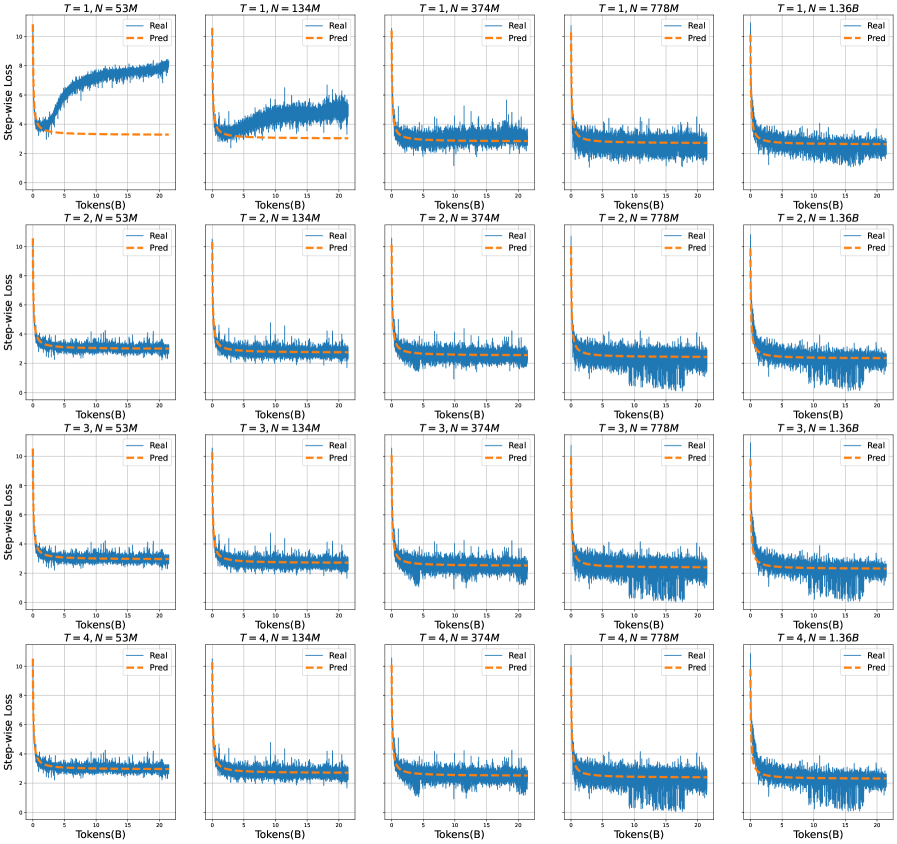
The image displays a 4x3 grid of 12 line graphs comparing "Real" and "Pred" step-wise loss values across varying model sizes (N) and time steps (T). Each graph represents a unique combination of T (1–4), N (53M, 134M, 374M, 778M, 1.36B), and B (20). The x-axis measures "Tokens(B)" (0–20B), and the y-axis measures "Step-wise Loss" (0–10). The legend distinguishes "Real" (solid blue line) and "Pred" (dashed orange line).
---
### Components/Axes
- **X-axis**: "Tokens(B)" (0–20B), labeled in billions.
- **Y-axis**: "Step-wise Loss" (0–10), with increments of 2.
- **Legend**:
- **Real**: Solid blue line (top-right corner of each graph).
- **Pred**: Dashed orange line (top-right corner of each graph).
- **Graph Titles**: Each graph is labeled with parameters:
- **T**: Time step (1–4).
- **N**: Model size (53M, 134M, 374M, 778M, 1.36B).
- **B**: Constant value (20) across all graphs.
---
### Detailed Analysis
#### Trends
1. **Real Line (Blue)**:
- Starts at ~8–10 loss, decreases gradually over tokens, then plateaus near ~2–4 loss.
- Larger N values (e.g., 1.36B) show slower initial decline but similar plateau levels.
2. **Pred Line (Orange Dashed)**:
- Begins flat (~8–10 loss), then drops sharply to ~2–4 loss within ~5B tokens, then plateaus.
- Larger N values (e.g., 1.36B) exhibit steeper initial declines and lower plateau levels.
3. **Consistency**:
- Pred loss is consistently lower than Real loss across all N and T values.
- Larger N values (e.g., 1.36B) show more pronounced drops in Pred loss compared to smaller N (e.g., 53M).
#### Data Points
- **X-axis (Tokens)**:
- All graphs span 0–20B tokens.
- Pred line stabilizes near 5–10B tokens; Real line stabilizes later (~10–15B tokens).
- **Y-axis (Loss)**:
- Real loss plateaus between 2–4.
- Pred loss plateaus between 2–3, with larger N values achieving lower plateaus.
---
### Key Observations
1. **Prediction Superiority**: The "Pred" line (orange dashed) consistently underperforms "Real" (blue) in loss, indicating better model performance.
2. **Model Size Impact**: Larger N values (e.g., 1.36B) show steeper declines in Pred loss, suggesting improved efficiency with scale.
3. **Time Step Stability**: No significant variation in trends across T=1–4, implying time step has minimal impact on loss dynamics.
4. **B Parameter**: Constant B=20 across all graphs; no visible effect on loss trends.
---
### Interpretation
The data demonstrates that the "Pred" model (orange dashed line) achieves lower step-wise loss than the "Real" model (blue line) across all configurations. This suggests the prediction model is more effective, particularly for larger model sizes (N=1.36B), where the loss drops sharply and stabilizes at lower values. The consistency of trends across T=1–4 indicates that time step does not significantly influence the loss dynamics. The constant B=20 parameter implies it is not a variable in this analysis. The results highlight the importance of model scale in optimizing performance, as larger N values correlate with more efficient loss reduction.