\n
## Bar Chart: ROUGE-L F1 Score vs. Training Tokens
### Overview
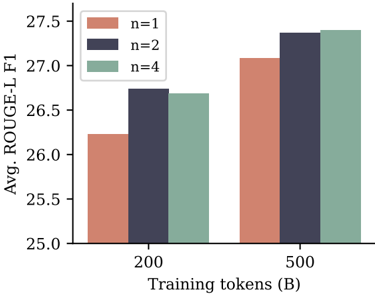
This bar chart displays the average ROUGE-L F1 score for different values of 'n' (1, 2, and 4) at two training token sizes: 200B and 500B. The chart visually compares the performance of each 'n' value at each training token size.
### Components/Axes
* **X-axis:** Training tokens (B) - with markers at 200 and 500.
* **Y-axis:** Avg. ROUGE-L F1 - ranging from approximately 25.0 to 27.5.
* **Legend:** Located in the top-left corner, defining the colors for each 'n' value:
* n=1 (Light Red/Salmon)
* n=2 (Dark Blue/Navy)
* n=4 (Light Green/Seafoam)
### Detailed Analysis
The chart consists of six bars, representing the ROUGE-L F1 scores for each combination of 'n' and training token size.
* **n=1:**
* At 200B training tokens: Approximately 26.2. The bar extends from roughly 25.9 to 26.5.
* At 500B training tokens: Approximately 27.0. The bar extends from roughly 26.8 to 27.2.
* **n=2:**
* At 200B training tokens: Approximately 26.7. The bar extends from roughly 26.5 to 26.9.
* At 500B training tokens: Approximately 27.3. The bar extends from roughly 27.1 to 27.5.
* **n=4:**
* At 200B training tokens: Approximately 26.6. The bar extends from roughly 26.4 to 26.8.
* At 500B training tokens: Approximately 27.2. The bar extends from roughly 27.0 to 27.4.
All three 'n' values show an increase in ROUGE-L F1 score when the training token size increases from 200B to 500B. The 'n=2' consistently has the highest ROUGE-L F1 score at both training token sizes.
### Key Observations
* Increasing the training token size consistently improves the ROUGE-L F1 score for all 'n' values.
* 'n=2' consistently outperforms 'n=1' and 'n=4' at both training token sizes.
* The difference in performance between 'n=1' and 'n=4' is relatively small.
### Interpretation
The data suggests that increasing the number of training tokens generally leads to improved performance, as measured by the ROUGE-L F1 score. The optimal value for 'n' appears to be 2, as it consistently yields the highest scores. This could indicate that using a larger context window (represented by 'n') during training is beneficial up to a certain point, but beyond that, the gains diminish or even decrease. The relatively small difference between 'n=1' and 'n=4' suggests that there may be diminishing returns from increasing the context window beyond a certain size. The ROUGE-L F1 score is a metric for evaluating the quality of text summarization or machine translation, so this data likely relates to the performance of a language model on such tasks. The 'B' in the x-axis label indicates that the training token size is measured in billions of tokens.