\n
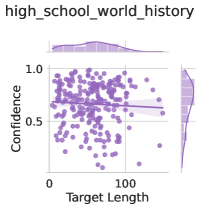
## Scatter Plot: Confidence vs. Target Length for High School World History
### Overview
The image presents a scatter plot visualizing the relationship between "Target Length" and "Confidence" for data related to "high_school_world_history". A regression line with a shaded confidence interval is overlaid on the scatter points. Marginal distributions (histograms) are displayed above and to the right of the main plot.
### Components/Axes
* **Title:** "high\_school\_world\_history" (top-left)
* **X-axis:** "Target Length" (ranging from approximately 0 to 120)
* **Y-axis:** "Confidence" (ranging from approximately 0.4 to 1.0)
* **Scatter Points:** Numerous purple dots representing individual data points.
* **Regression Line:** A dark purple line representing the trend of the data.
* **Confidence Interval:** A light purple shaded area around the regression line.
* **Marginal Distribution (Top):** A purple histogram showing the distribution of "Target Length".
* **Marginal Distribution (Right):** A purple histogram showing the distribution of "Confidence".
### Detailed Analysis
The scatter plot shows a slight negative correlation between "Target Length" and "Confidence". As "Target Length" increases, "Confidence" tends to decrease, but the relationship is weak.
* **Regression Line Trend:** The regression line slopes downward slightly.
* **Data Point Distribution:** The data points are clustered, but with significant scatter.
* **Target Length Distribution:** The distribution of "Target Length" is approximately normal, peaking around a value of 50, with a long tail extending to higher values.
* **Confidence Distribution:** The distribution of "Confidence" is skewed towards higher values, with a peak around 0.75.
Approximate Data Points (sampled for illustration, not exhaustive):
* Target Length = 0, Confidence ≈ 0.85
* Target Length = 25, Confidence ≈ 0.90
* Target Length = 50, Confidence ≈ 0.75
* Target Length = 75, Confidence ≈ 0.65
* Target Length = 100, Confidence ≈ 0.55
* Target Length = 120, Confidence ≈ 0.45
### Key Observations
* The negative correlation between "Target Length" and "Confidence" is weak.
* The data is quite dispersed, indicating that "Target Length" is not a strong predictor of "Confidence".
* The marginal distributions provide insights into the individual distributions of each variable.
### Interpretation
The data suggests that, for "high\_school\_world\_history", longer target lengths are associated with slightly lower confidence scores, but this relationship is not strong. This could indicate that more complex or lengthy tasks (represented by "Target Length") are perceived as less certain or reliable. The marginal distributions show that "Target Length" is relatively evenly distributed, while "Confidence" tends to be higher. The weak correlation suggests that other factors likely play a more significant role in determining confidence levels than simply the length of the target. The scatter suggests that the model is not a strong predictor of confidence. The data does not provide any information about the nature of the "Target Length" or "Confidence" metrics. Further investigation would be needed to understand the context and meaning of these variables.