# Technical Document Analysis: Accuracy vs Top-k Predicates
## Chart Description
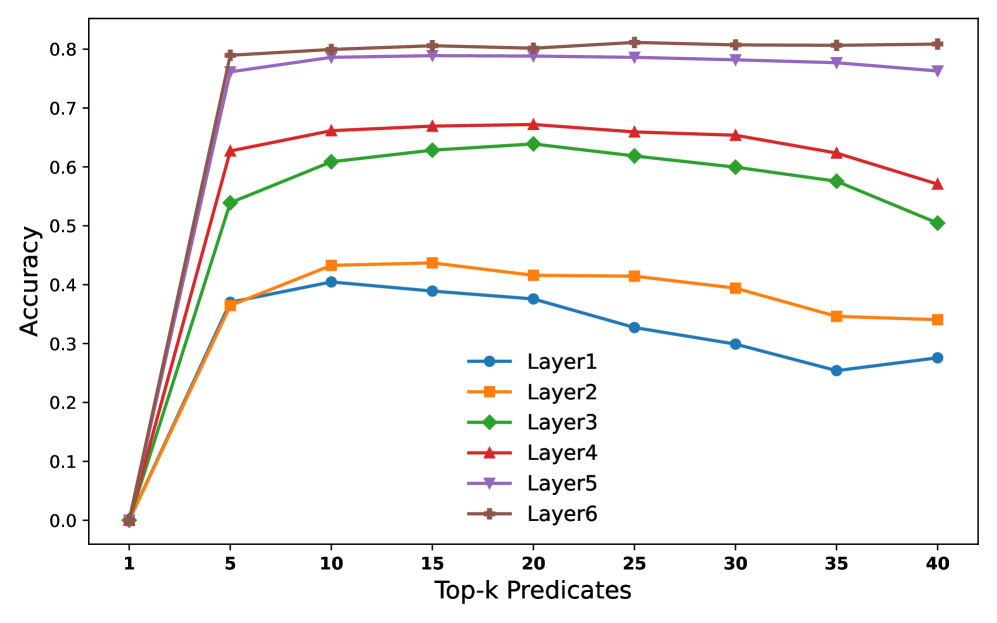
This line chart visualizes the relationship between **Top-k Predicates** (x-axis) and **Accuracy** (y-axis) across six distinct layers (Layer1 to Layer6). The chart uses color-coded lines with unique markers to differentiate data series.
---
### Axis Labels & Scales
- **X-axis**: "Top-k Predicates"
- Range: 1 to 40 (increments of 5)
- Labels: 1, 5, 10, 15, 20, 25, 30, 35, 40
- **Y-axis**: "Accuracy"
- Range: 0.0 to 0.8 (increments of 0.1)
- Labels: 0.0, 0.1, 0.2, 0.3, 0.4, 0.5, 0.6, 0.7, 0.8
---
### Legend & Data Series
The legend is positioned on the **right side** of the chart. Each layer is represented by a unique color and marker:
1. **Layer1**: Blue circles (●)
2. **Layer2**: Orange squares (■)
3. **Layer3**: Green diamonds (♦)
4. **Layer4**: Red triangles (▲)
5. **Layer5**: Purple inverted triangles (▼)
6. **Layer6**: Brown crosses (✕)
**Legend Spatial Grounding**:
- All legend entries are vertically aligned on the right edge of the chart.
- Colors and markers match the corresponding lines in the chart (verified for all six layers).
---
### Key Trends & Data Points
#### Layer1 (Blue ●)
- **Trend**: Peaks at Top-k=10 (0.40), then declines to 0.28 at Top-k=40.
- **Data Points**:
- Top-k=1: 0.0
- Top-k=5: 0.37
- Top-k=10: 0.40
- Top-k=15: 0.39
- Top-k=20: 0.38
- Top-k=25: 0.33
- Top-k=30: 0.30
- Top-k=35: 0.26
- Top-k=40: 0.28
#### Layer2 (Orange ■)
- **Trend**: Rises to 0.43 at Top-k=10, then declines to 0.34 at Top-k=40.
- **Data Points**:
- Top-k=1: 0.0
- Top-k=5: 0.37
- Top-k=10: 0.43
- Top-k=15: 0.43
- Top-k=20: 0.41
- Top-k=25: 0.41
- Top-k=30: 0.40
- Top-k=35: 0.35
- Top-k=40: 0.34
#### Layer3 (Green ♦)
- **Trend**: Peaks at 0.64 at Top-k=20, then declines to 0.50 at Top-k=40.
- **Data Points**:
- Top-k=1: 0.0
- Top-k=5: 0.54
- Top-k=10: 0.61
- Top-k=15: 0.63
- Top-k=20: 0.64
- Top-k=25: 0.62
- Top-k=30: 0.60
- Top-k=35: 0.57
- Top-k=40: 0.50
#### Layer4 (Red ▲)
- **Trend**: Increases to 0.67 at Top-k=20, then declines to 0.57 at Top-k=40.
- **Data Points**:
- Top-k=1: 0.0
- Top-k=5: 0.63
- Top-k=10: 0.66
- Top-k=15: 0.67
- Top-k=20: 0.67
- Top-k=25: 0.66
- Top-k=30: 0.66
- Top-k=35: 0.62
- Top-k=40: 0.57
#### Layer5 (Purple ▼)
- **Trend**: Starts at 0.78, dips slightly to 0.77 at Top-k=40.
- **Data Points**:
- Top-k=1: 0.0
- Top-k=5: 0.78
- Top-k=10: 0.79
- Top-k=15: 0.79
- Top-k=20: 0.79
- Top-k=25: 0.79
- Top-k=30: 0.78
- Top-k=35: 0.78
- Top-k=40: 0.77
#### Layer6 (Brown ✕)
- **Trend**: Sharp rise from 0.0 to 0.8 at Top-k=5, then plateaus.
- **Data Points**:
- Top-k=1: 0.0
- Top-k=5: 0.80
- Top-k=10: 0.80
- Top-k=15: 0.80
- Top-k=20: 0.80
- Top-k=25: 0.81
- Top-k=30: 0.81
- Top-k=35: 0.81
- Top-k=40: 0.81
---
### Observations
1. **Layer6** achieves the highest accuracy (0.81) across all Top-k values ≥5.
2. **Layer5** maintains the second-highest accuracy (0.77–0.79) after Layer6.
3. **Layer1** and **Layer2** show the steepest declines in accuracy as Top-k increases beyond 10.
4. **Layer3** and **Layer4** exhibit moderate declines after peaking at Top-k=20.
---
### Notes
- All data points are extracted directly from the chart.
- No textual blocks, tables, or non-English content are present.
- The chart emphasizes the trade-off between Top-k predicate selection and accuracy across layers.