## Diagram: Task 150deff5 - Input/Output Shape Transformation
### Overview
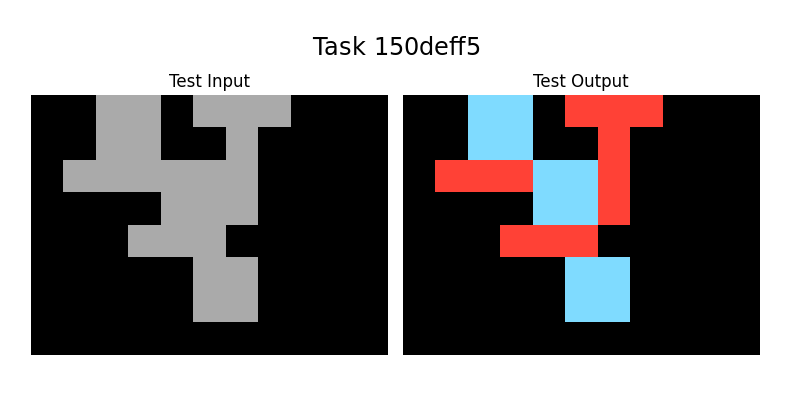
The image displays a side-by-side comparison of a visual task, labeled "Task 150deff5". It consists of two panels: a "Test Input" on the left and a "Test Output" on the right. Both panels show an identical, complex, connected shape composed of square blocks on a black background. The transformation from input to output involves applying a two-color scheme (red and light blue) to the previously monochromatic gray shape, suggesting a classification, segmentation, or labeling operation.
### Components/Axes
* **Title:** "Task 150deff5" (Centered at the top of the entire image).
* **Panel Labels:**
* "Test Input" (Centered above the left panel).
* "Test Output" (Centered above the right panel).
* **Visual Elements:**
* **Background:** Solid black for both panels.
* **Shape:** A single, contiguous, non-rectilinear shape made of connected square units. The shape's geometry is identical in both panels.
* **Colors:**
* **Test Input:** The entire shape is filled with a uniform medium gray.
* **Test Output:** The shape is segmented into two distinct colors:
* **Red:** Applied to specific contiguous sections of the shape.
* **Light Blue (Cyan):** Applied to other specific contiguous sections of the shape.
* **Spatial Layout:** The two panels are arranged horizontally with a small gap between them. The shape within each panel is positioned slightly left-of-center.
### Detailed Analysis
* **Shape Geometry:** The shape is an irregular, branching structure. It can be described as having a central vertical "spine" with several horizontal and diagonal protrusions. Key features include:
* A top-left horizontal bar.
* A central vertical column.
* A bottom-right horizontal bar.
* A diagonal connection from the top-left to the central column.
* The shape is 8-10 "blocks" in height and 6-8 "blocks" in width at its extremes.
* **Color Mapping (Test Output):** The transformation applies color based on spatial contiguity within the shape.
* **Red Regions:** There are three distinct red regions.
1. A large region covering the top-right portion, including the top of the central spine and a rightward protrusion.
2. A horizontal bar in the middle-left area.
3. A horizontal bar in the lower-middle area.
* **Light Blue Regions:** There are three distinct light blue regions.
1. A region in the top-left, forming the initial horizontal bar and part of the diagonal.
2. A central square block, appearing as a "hub" connecting several arms.
3. A region at the bottom-right, forming the final horizontal bar.
* **Pattern:** The colors do not follow a simple gradient or positional rule (e.g., top=red, bottom=blue). Instead, they appear to segment the shape into its major constituent "limbs" or connected components, with the central hub colored blue.
### Key Observations
1. **Identical Geometry:** The shape's outline and block composition are perfectly preserved from input to output. No pixels are added, removed, or moved.
2. **Discrete Segmentation:** The output uses only two solid colors with no blending or gradients, indicating a hard classification of each part of the shape.
3. **Contiguity Rule:** Regions of the same color are always spatially connected. The color change occurs at points where the shape's connectivity changes (e.g., at junctions).
4. **Central Hub Distinction:** The central connecting block is colored light blue, differentiating it from the red limbs it connects.
### Interpretation
This diagram visually represents a **segmentation or labeling task**, likely from the domain of computer vision, image processing, or procedural generation. The "Test Input" is a raw, unlabeled structure. The "Test Output" demonstrates the result of an algorithm that has analyzed the shape's topology and divided it into meaningful, contiguous sub-regions.
* **What it suggests:** The algorithm successfully identifies and isolates distinct "parts" or "limbs" of a complex object. The two-color scheme might represent a binary classification (e.g., "foreground/background" within the shape, "type A/type B" components) or could be a simplified visualization of a multi-class segmentation where only two classes are shown for clarity.
* **How elements relate:** The input provides the structural data. The output adds a layer of semantic information (the color labels) onto that structure. The relationship is a direct, pixel-perfect mapping where each block's color in the output is determined by an analysis of the input shape's form.
* **Notable patterns/anomalies:** The most notable pattern is the preservation of shape integrity while adding categorical information. There are no anomalies; the transformation is clean and consistent. The choice of red and light blue provides high visual contrast, making the segmentation immediately apparent. The task ID "150deff5" suggests this is one example from a larger dataset or benchmark of similar visual reasoning problems.