## Heatmaps: Flow Field Comparisons
### Overview
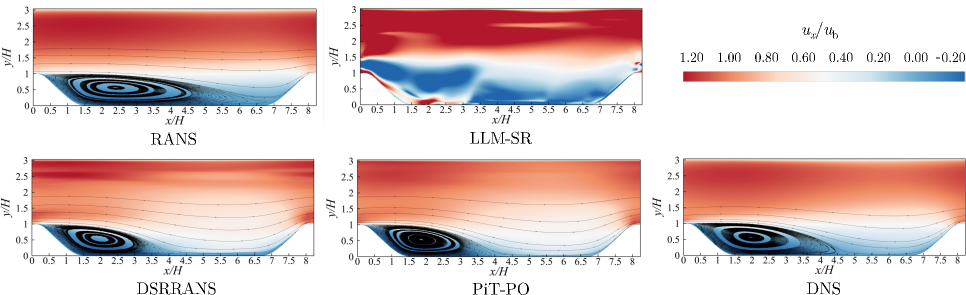
The image presents a 2x3 grid of heatmaps, each representing a different computational model of a flow field. Each heatmap visualizes the normalized streamwise velocity (u<sub>x</sub>/u<sub>b</sub>) as a function of normalized streamwise (x/H) and vertical (y/H) coordinates. The models compared are RANS, LLM-SR, DSBRANS, PIT-PO, and DNS. A color scale is provided in the top-right corner to interpret the velocity values.
### Components/Axes
* **x/H Axis:** Represents the normalized streamwise coordinate, ranging from 0 to 8, with tick marks at intervals of 0.5.
* **y/H Axis:** Represents the normalized vertical coordinate, ranging from 0 to 3, with tick marks at intervals of 0.5.
* **Color Scale:** Represents the normalized streamwise velocity (u<sub>x</sub>/u<sub>b</sub>). The scale ranges from -0.20 (dark blue) to 1.20 (dark red), with intermediate values of -0.02, 0.20, 0.40, 0.60, 0.80, and 1.00.
* **Labels:** Each heatmap is labeled with the corresponding model name: RANS, LLM-SR, DSBRANS, PIT-PO, and DNS.
* **Legend:** Located in the top-right corner, the legend maps colors to u<sub>x</sub>/u<sub>b</sub> values.
### Detailed Analysis or Content Details
Each heatmap displays a similar flow pattern, characterized by a recirculation zone near x/H = 1.0 and a region of accelerated flow further downstream. The color intensity indicates the magnitude of the normalized streamwise velocity.
**RANS:**
* The recirculation zone is visible as a dark blue region.
* The maximum positive velocity (dark red) is observed around x/H = 6.5, y/H = 1.5. The value is approximately 1.10.
* The velocity gradient is relatively smooth.
**LLM-SR:**
* The recirculation zone is more pronounced and extends further downstream compared to RANS.
* The maximum positive velocity is around x/H = 7.0, y/H = 1.5, with a value of approximately 1.15.
* There is a sharper velocity gradient near the top boundary (y/H = 3).
**DSBRANS:**
* The recirculation zone is similar in size to RANS.
* The maximum positive velocity is around x/H = 6.5, y/H = 1.5, with a value of approximately 1.10.
* The velocity gradient is smoother than LLM-SR.
**PIT-PO:**
* The recirculation zone is well-defined and similar to LLM-SR.
* The maximum positive velocity is around x/H = 7.0, y/H = 1.5, with a value of approximately 1.15.
* The velocity gradient is relatively sharp.
**DNS:**
* The recirculation zone is similar to LLM-SR and PIT-PO.
* The maximum positive velocity is around x/H = 7.0, y/H = 1.5, with a value of approximately 1.15.
* The velocity gradient is sharp, with fine-scale structures visible.
### Key Observations
* All models capture the basic flow features, but differ in the size and intensity of the recirculation zone and the sharpness of the velocity gradients.
* RANS appears to underestimate the size of the recirculation zone.
* LLM-SR, PIT-PO, and DNS show similar flow structures, with a more pronounced recirculation zone and sharper gradients.
* The maximum normalized velocity is approximately consistent across all models, around 1.10-1.15.
### Interpretation
The heatmaps compare the performance of different turbulence models in simulating a flow field. The DNS result is often considered the "ground truth" for such simulations. The comparison suggests that RANS is the least accurate model, underpredicting the recirculation zone. LLM-SR, PIT-PO, and DNS provide more realistic representations of the flow, capturing the complex flow structures with greater fidelity. The differences in velocity gradients highlight the ability of higher-fidelity models to resolve smaller-scale flow features. The consistent maximum velocity across models suggests that the overall momentum balance is reasonably well-captured by all models, but the distribution of velocity is significantly different. This data is valuable for assessing the suitability of different turbulence models for specific flow applications.