## Multi-Line Chart: Model Performance Across Mathematical Benchmarks
### Overview
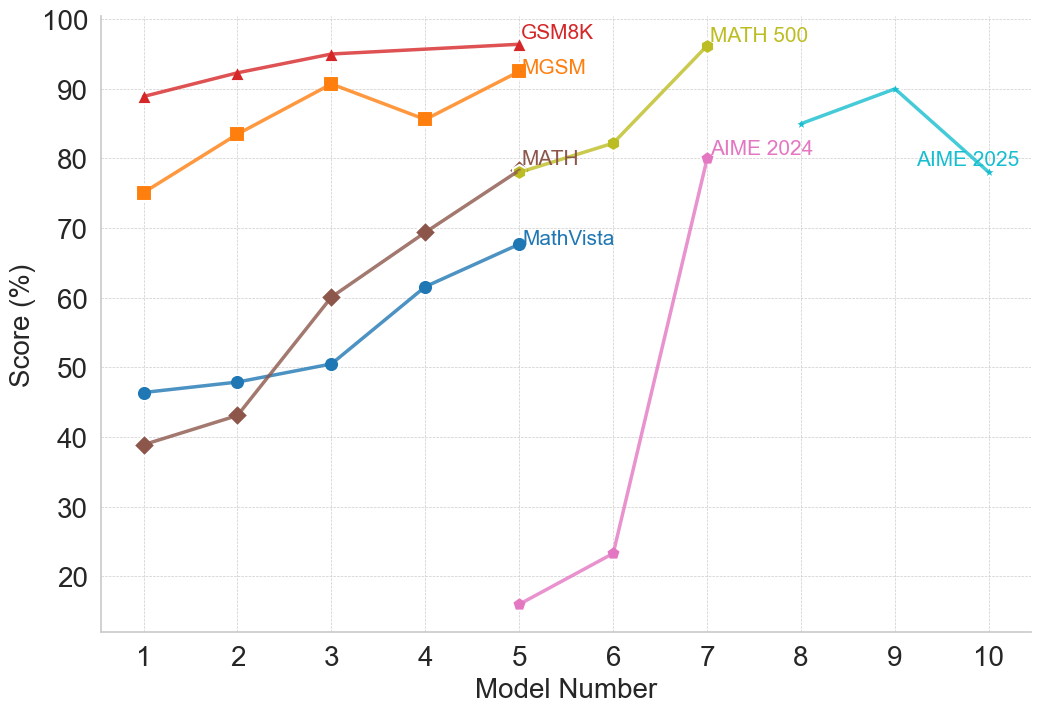
The image is a multi-line chart plotting the performance scores (in percentage) of ten different models (labeled 1 through 10) across seven distinct mathematical reasoning benchmarks. Each benchmark is represented by a uniquely colored line with specific markers. The chart illustrates how model performance varies and generally improves across the sequence of models for most tasks.
### Components/Axes
* **X-Axis:** Labeled "Model Number". It is a categorical axis with discrete integer markers from 1 to 10.
* **Y-Axis:** Labeled "Score (%)". It is a linear scale ranging from 0 to 100, with major gridlines at intervals of 10%.
* **Legend/Series Labels:** The legend is embedded directly within the chart area, with labels placed near the end of their respective lines. The series are:
1. **GSM8K:** Red line with upward-pointing triangle markers.
2. **MGSM:** Orange line with square markers.
3. **MATH:** Brown line with diamond markers.
4. **MathVista:** Blue line with circle markers.
5. **MATH 500:** Yellow-green line with circle markers.
6. **AIME 2024:** Pink line with circle markers.
7. **AIME 2025:** Cyan line with circle markers.
### Detailed Analysis
**Data Series Trends and Approximate Values:**
1. **GSM8K (Red, Triangles):**
* **Trend:** Consistently high and slowly increasing.
* **Data Points:** Model 1: ~89%, Model 2: ~92%, Model 3: ~95%, Model 4: ~96%, Model 5: ~97%.
2. **MGSM (Orange, Squares):**
* **Trend:** Generally upward with a notable dip at Model 4.
* **Data Points:** Model 1: ~75%, Model 2: ~84%, Model 3: ~91%, Model 4: ~86%, Model 5: ~93%.
3. **MATH (Brown, Diamonds):**
* **Trend:** Strong, steady upward slope.
* **Data Points:** Model 1: ~39%, Model 2: ~43%, Model 3: ~60%, Model 4: ~69%, Model 5: ~78%.
4. **MathVista (Blue, Circles):**
* **Trend:** Steady, moderate upward slope.
* **Data Points:** Model 1: ~46%, Model 2: ~48%, Model 3: ~50%, Model 4: ~61%, Model 5: ~68%.
5. **MATH 500 (Yellow-Green, Circles):**
* **Trend:** Sharp increase between Model 6 and Model 7.
* **Data Points:** Model 6: ~82%, Model 7: ~96%. (Data only present for these two models).
6. **AIME 2024 (Pink, Circles):**
* **Trend:** Very sharp, dramatic increase from a low base.
* **Data Points:** Model 5: ~16%, Model 6: ~23%, Model 7: ~80%.
7. **AIME 2025 (Cyan, Circles):**
* **Trend:** Increases to a peak at Model 9, then declines.
* **Data Points:** Model 8: ~85%, Model 9: ~90%, Model 10: ~78%.
### Key Observations
* **Performance Hierarchy:** For the models where data is available (Models 1-5), GSM8K and MGSM consistently yield the highest scores, while MATH and MathVista start lower but show significant improvement.
* **Dramatic Improvements:** The most striking improvements are seen in the AIME 2024 series (from ~23% at Model 6 to ~80% at Model 7) and the MATH 500 series (from ~82% to ~96% between Models 6 and 7).
* **Non-Linear Progression:** Performance does not always improve monotonically. MGSM shows a dip at Model 4, and AIME 2025 peaks at Model 9 before falling at Model 10.
* **Benchmark Introduction Points:** Different benchmarks appear to be evaluated on different subsets of models. GSM8K, MGSM, MATH, and MathVista are plotted for Models 1-5. MATH 500 and AIME 2024 are plotted for Models 5-7. AIME 2025 is plotted for Models 8-10.
### Interpretation
This chart visualizes the progression of capability across a series of AI models on standardized mathematical reasoning tasks. The data suggests several key insights:
1. **General Upward Trajectory:** The overarching trend is one of improvement, indicating that successive models (as numbered) generally become better at solving mathematical problems. This is most clearly seen in the steady climbs of the MATH and MathVista benchmarks.
2. **Task-Dependent Performance:** Models excel at different tasks to varying degrees. Foundational arithmetic (GSM8K) appears to be a strength early on, while more complex competition-style problems (AIME) show explosive growth later, suggesting a phase shift in capability for those specific tasks.
3. **Potential Evaluation Shifts:** The disjointed plotting of benchmarks (e.g., AIME starting at Model 5 or 8) may indicate when these evaluation suites were introduced or became relevant to the model development cycle. The sharp jumps in AIME 2024 and MATH 500 could correspond to a significant architectural or training breakthrough that specifically benefited those types of problems.
4. **The AIME 2025 Anomaly:** The decline in AIME 2025 score from Model 9 to Model 10 is a notable outlier. This could indicate a limitation, a trade-off in model specialization, or simply noise in the evaluation. It raises the question of whether performance on future-dated benchmarks (like AIME 2025) follows the same improvement pattern as historical ones.
In essence, the chart documents a narrative of advancing AI mathematical reasoning, highlighting both consistent progress and moments of dramatic, task-specific breakthrough, while also hinting at the complexities and potential plateaus in scaling model capabilities.