## Bar Chart: Tool Execution Time Distribution
### Overview
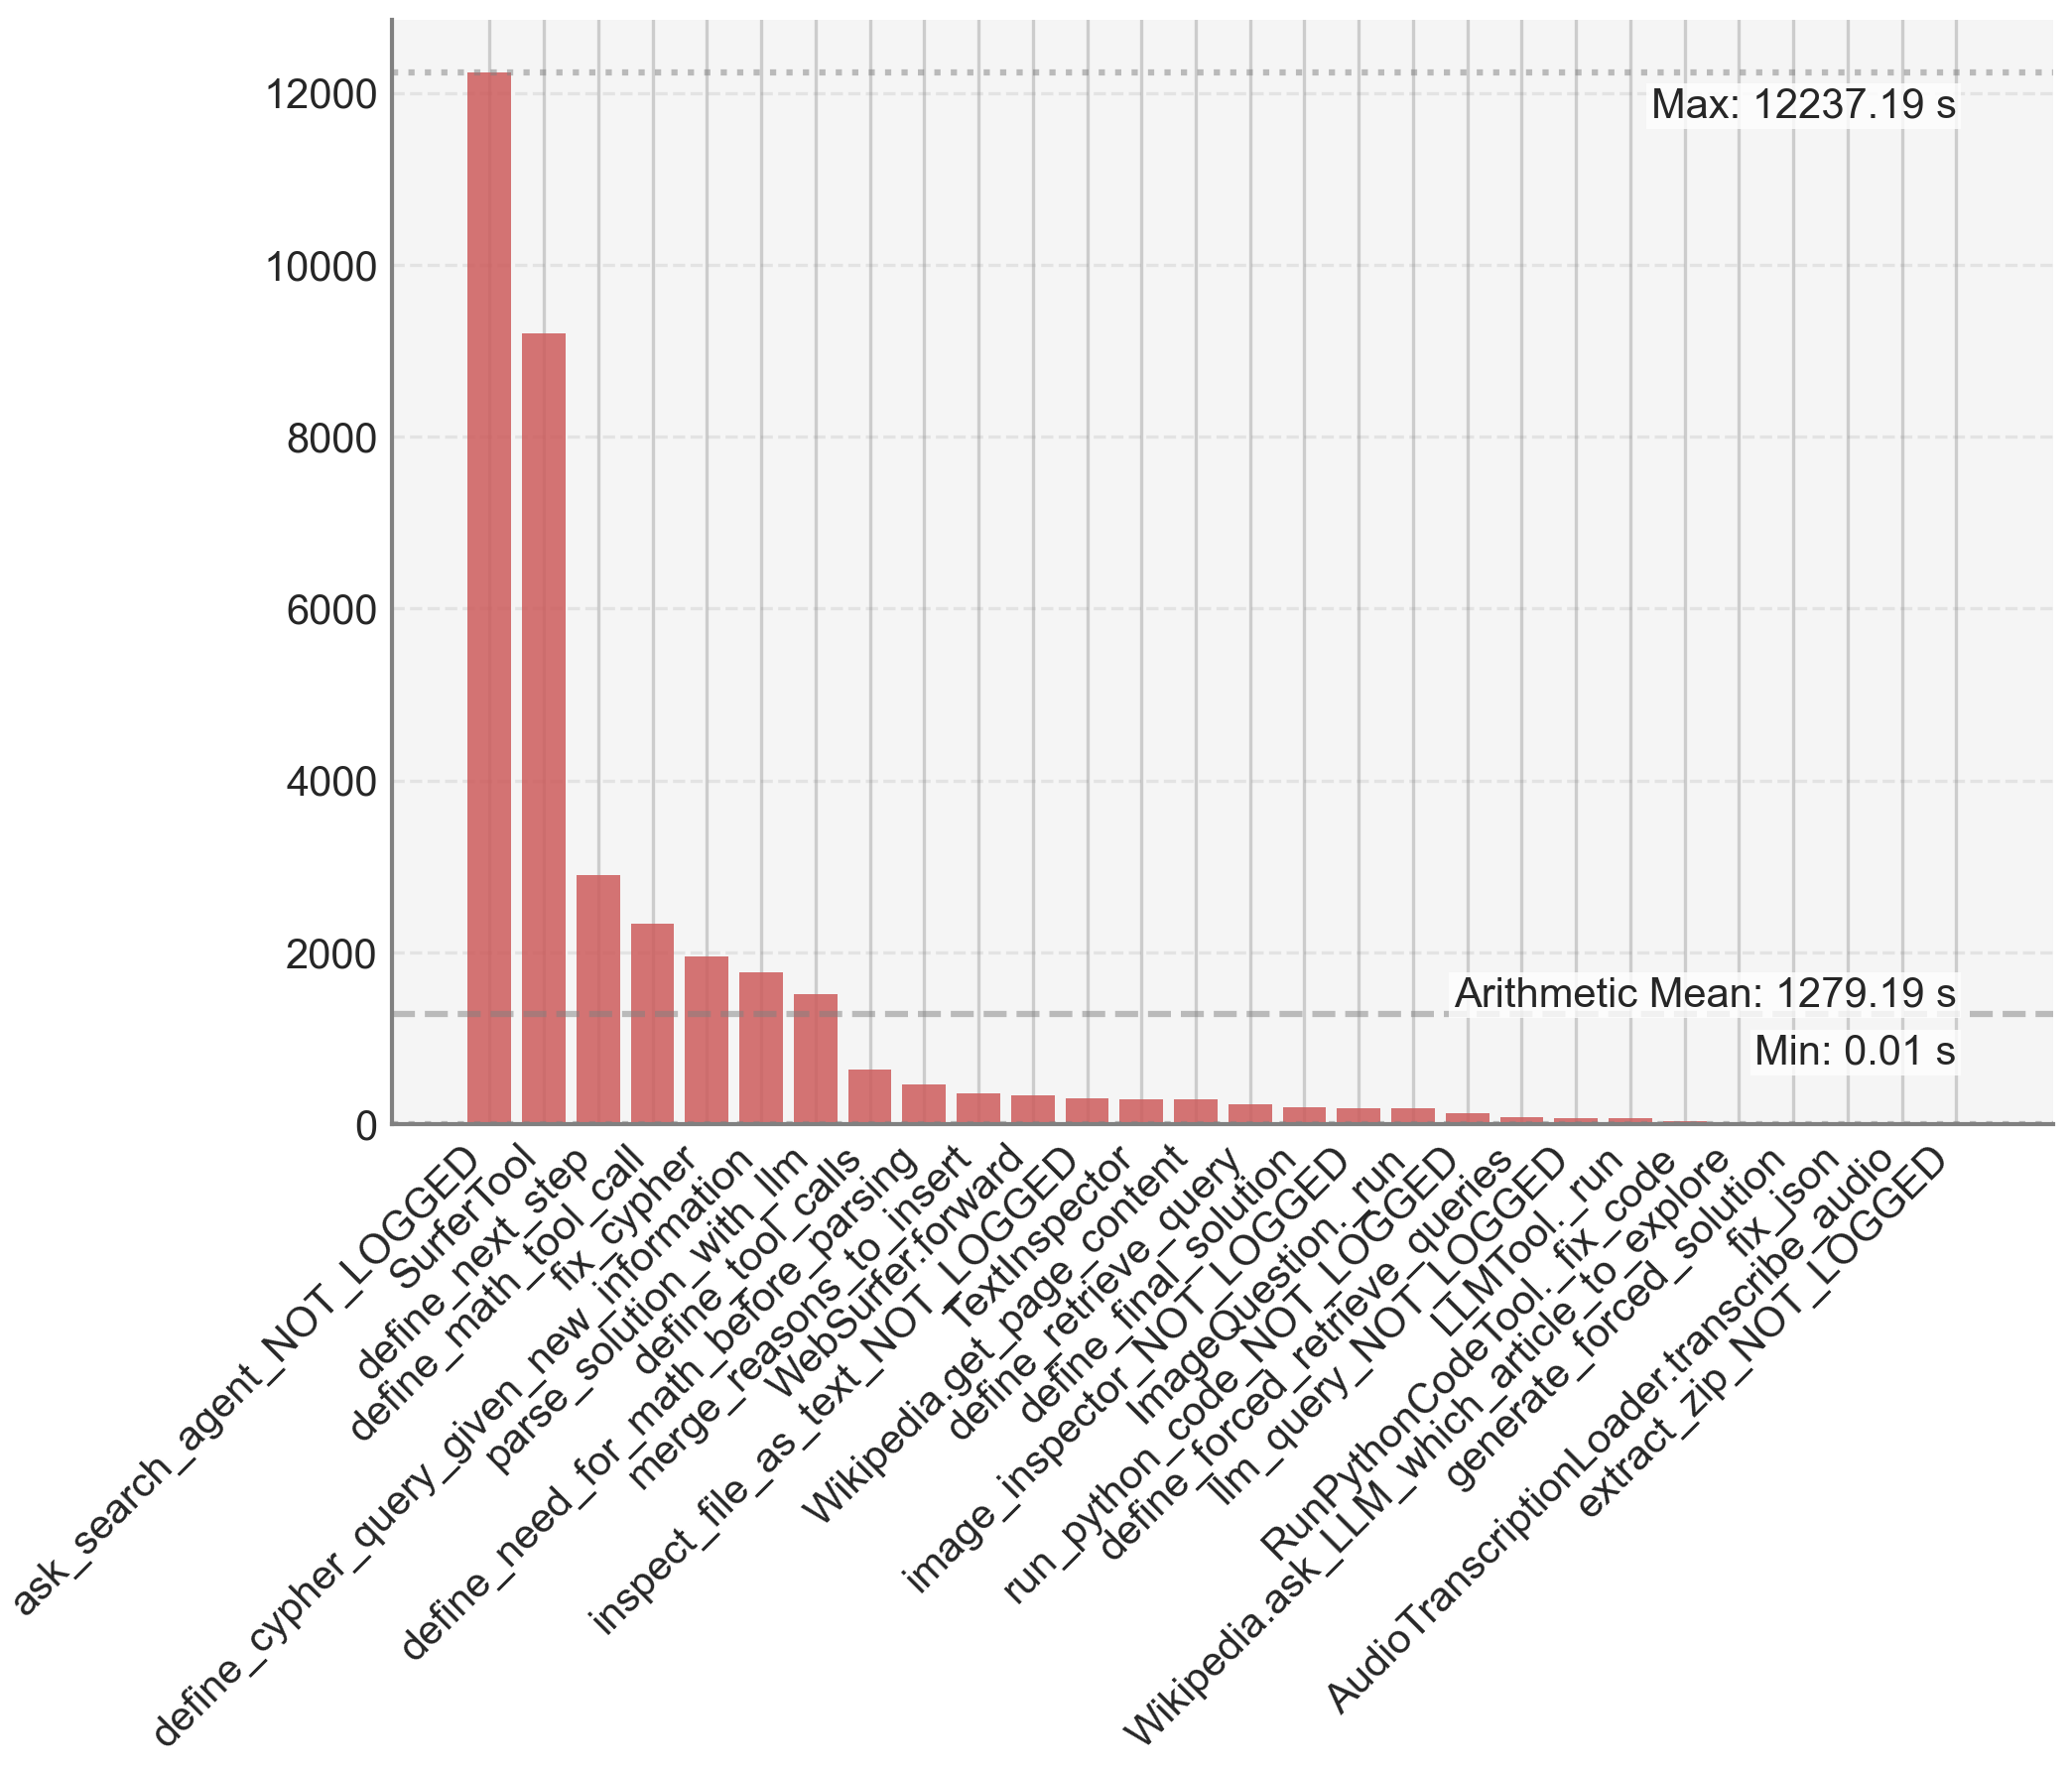
This image is a vertical bar chart displaying the execution times (in seconds) for a series of distinct computational tools or functions, likely from an AI agent or software system's performance log. The chart is sorted in descending order of execution time, revealing a highly skewed distribution where a few tools consume the vast majority of time.
### Components/Axes
* **Chart Type:** Vertical Bar Chart.
* **X-Axis (Horizontal):** Lists the names of 30 distinct tools/functions. The labels are rotated approximately 60 degrees for readability. From left to right, the labels are:
1. `ask_search_agent_NOT_LOGGED`
2. `SurferTool`
3. `define_next_step`
4. `define_math_tool_call`
5. `fix_cypher`
6. `define_given_new_information`
7. `parse_solution_with_llm`
8. `define_tool_calls`
9. `define_need_for_math_before_parsing`
10. `merge_reasons_to_insert`
11. `WebSurfer.forward`
12. `inspect_file_as_text_NOT_LOGGED`
13. `TextInspector`
14. `Wikipedia.get_page_content`
15. `define_retrieve_query`
16. `define_final_solution`
17. `image_inspector_NOT_LOGGED`
18. `ImageQuestion.run`
19. `run_python_code_NOT_LOGGED`
20. `define_forced_retrieve_queries`
21. `llm_query_NOT_LOGGED`
22. `RunPythonCodeTool._run`
23. `Wikipedia.ask_LLM_which_article_to_explore`
24. `fix_code`
25. `generate_forced_solution`
26. `fix_json`
27. `AudioTranscriptionLoader.transcribe_audio`
28. `extract_zip_NOT_LOGGED`
* **Y-Axis (Vertical):** Represents time in seconds. The scale runs from 0 to 12000, with major gridlines at intervals of 2000 (0, 2000, 4000, 6000, 8000, 10000, 12000).
* **Annotations (Top-Right Corner):**
* `Max: 12237.19 s` (aligned with the top of the tallest bar).
* `Arithmetic Mean: 1279.19 s` (indicated by a horizontal dashed line crossing the chart).
* `Min: 0.01 s` (aligned with the baseline of the shortest bars).
* **Visual Elements:** All bars are a uniform muted red/terracotta color. The background is a light gray with a faint grid.
### Detailed Analysis
The data presents a classic "long tail" distribution. The execution times are listed below in descending order, with approximate values estimated from the bar heights relative to the y-axis scale.
1. **`ask_search_agent_NOT_LOGGED`**: ~12,200 s (The tallest bar, reaching the annotated maximum).
2. **`SurferTool`**: ~9,200 s.
3. **`define_next_step`**: ~2,900 s.
4. **`define_math_tool_call`**: ~2,300 s.
5. **`fix_cypher`**: ~2,000 s.
6. **`define_given_new_information`**: ~1,800 s.
7. **`parse_solution_with_llm`**: ~1,500 s.
8. **`define_tool_calls`**: ~600 s.
9. **`define_need_for_math_before_parsing`**: ~450 s.
10. **`merge_reasons_to_insert`**: ~350 s.
11. **`WebSurfer.forward`**: ~300 s.
12. **`inspect_file_as_text_NOT_LOGGED`**: ~280 s.
13. **`TextInspector`**: ~250 s.
14. **`Wikipedia.get_page_content`**: ~220 s.
15. **`define_retrieve_query`**: ~200 s.
16. **`define_final_solution`**: ~180 s.
17. **`image_inspector_NOT_LOGGED`**: ~150 s.
18. **`ImageQuestion.run`**: ~120 s.
19. **`run_python_code_NOT_LOGGED`**: ~100 s.
20. **`define_forced_retrieve_queries`**: ~80 s.
21. **`llm_query_NOT_LOGGED`**: ~60 s.
22. **`RunPythonCodeTool._run`**: ~40 s.
23. **`Wikipedia.ask_LLM_which_article_to_explore`**: ~30 s.
24. **`fix_code`**: ~20 s.
25. **`generate_forced_solution`**: ~15 s.
26. **`fix_json`**: ~10 s.
27. **`AudioTranscriptionLoader.transcribe_audio`**: ~5 s.
28. **`extract_zip_NOT_LOGGED`**: ~0.01 s (The shortest bar, matching the annotated minimum).
**Trend Verification:** The visual trend is a steep, monotonic decline from left to right. The first two bars are extreme outliers, each several times larger than the third. After the seventh bar (`parse_solution_with_llm`), the times drop below the arithmetic mean line (1279.19 s) and continue to decrease rapidly, forming a long tail of tools with sub-500-second execution times.
### Key Observations
1. **Extreme Skew:** The top two tools (`ask_search_agent_NOT_LOGGED` and `SurferTool`) account for a disproportionate amount of total execution time. Their combined time (~21,400 s) is vastly greater than the sum of all other 26 tools.
2. **Performance Bottleneck:** The `ask_search_agent_NOT_LOGGED` function is the clear performance bottleneck, with a time (12237.19 s) nearly 10 times the arithmetic mean.
3. **Tool Categorization:** The tool names suggest a multi-step AI agent pipeline involving search (`ask_search_agent`, `SurferTool`), planning (`define_next_step`), code/math handling (`define_math_tool_call`, `fix_cypher`, `run_python_code`), information parsing (`parse_solution_with_llm`), and external service calls (`Wikipedia.get_page_content`, `AudioTranscriptionLoader`).
4. **Logging Status:** Several tools have the suffix `_NOT_LOGGED`, which may indicate they are internal or debug functions not typically recorded in standard logs, yet their performance is being measured here.
### Interpretation
This chart is a diagnostic tool for system performance optimization. It demonstrates that efforts to improve overall speed should be overwhelmingly focused on the first two functions, particularly `ask_search_agent_NOT_LOGGED`. Optimizing any of the tools in the long tail (e.g., `fix_json` or `extract_zip`) would yield negligible system-wide benefit.
The data suggests the agent's workflow is heavily bottlenecked by its initial search and web navigation phases (`SurferTool`). The subsequent steps of planning, reasoning, and executing specific tools (like code running or API calls) are relatively fast in comparison. This could indicate that the search agent is performing complex, time-consuming operations like multiple web retrievals, page parsing, or waiting on external APIs. The presence of `_NOT_LOGGED` in the names of the most expensive tools might also imply that these critical performance metrics are not being captured in standard operational monitoring, which could be a significant oversight. The mean (1279.19 s) is heavily influenced by the outliers and is not representative of the typical tool's execution time, which is mostly under 500 seconds.