## Chart: Layer vs. Delta P for Llama-3-8B and Llama-3-70B
### Overview
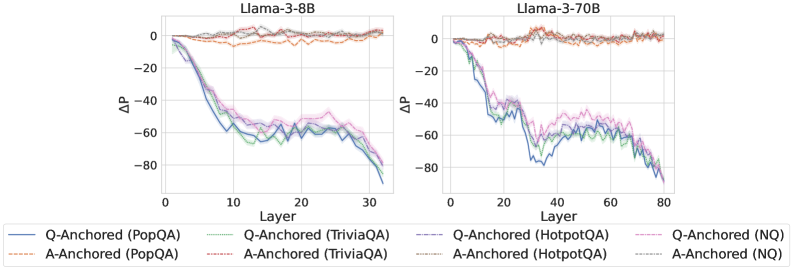
The image presents two line charts comparing the performance of Llama-3-8B and Llama-3-70B models across different layers. The y-axis represents the change in probability (ΔP), while the x-axis represents the layer number. Each chart displays six data series, representing different question-answering datasets (PopQA, TriviaQA, HotpotQA, and NQ) anchored by either the question (Q-Anchored) or the answer (A-Anchored).
### Components/Axes
* **Titles:**
* Left Chart: "Llama-3-8B"
* Right Chart: "Llama-3-70B"
* **Y-Axis:**
* Label: "ΔP"
* Scale: -80 to 0, with tick marks at -80, -60, -40, -20, and 0.
* **X-Axis:**
* Label: "Layer"
* Left Chart Scale: 0 to 30, with tick marks at 0, 10, 20, and 30.
* Right Chart Scale: 0 to 80, with tick marks at 0, 20, 40, 60, and 80.
* **Legend:** Located at the bottom of the image.
* **Q-Anchored (PopQA):** Solid Blue Line
* **A-Anchored (PopQA):** Dashed Brown Line
* **Q-Anchored (TriviaQA):** Dotted Green Line
* **A-Anchored (TriviaQA):** Dashed-Dotted Light Brown Line
* **Q-Anchored (HotpotQA):** Dashed-Dotted Purple Line
* **A-Anchored (HotpotQA):** Dotted Light Brown Line
* **Q-Anchored (NQ):** Dashed Purple Line
* **A-Anchored (NQ):** Dotted Light Gray Line
### Detailed Analysis
**Left Chart: Llama-3-8B**
* **Q-Anchored (PopQA):** (Solid Blue) Starts at approximately 0 and decreases sharply to approximately -80 by layer 30.
* **A-Anchored (PopQA):** (Dashed Brown) Remains relatively stable around 0 throughout all layers.
* **Q-Anchored (TriviaQA):** (Dotted Green) Starts at approximately 0 and decreases to approximately -65 by layer 30.
* **A-Anchored (TriviaQA):** (Dashed-Dotted Light Brown) Remains relatively stable around 0 throughout all layers.
* **Q-Anchored (HotpotQA):** (Dashed-Dotted Purple) Starts at approximately 0 and decreases to approximately -70 by layer 30.
* **A-Anchored (HotpotQA):** (Dotted Light Brown) Remains relatively stable around 0 throughout all layers.
* **Q-Anchored (NQ):** (Dashed Purple) Starts at approximately 0 and decreases to approximately -60 by layer 30.
* **A-Anchored (NQ):** (Dotted Light Gray) Remains relatively stable around 0 throughout all layers.
**Right Chart: Llama-3-70B**
* **Q-Anchored (PopQA):** (Solid Blue) Starts at approximately 0 and decreases sharply to approximately -80 by layer 30, then fluctuates between -60 and -80 until layer 80.
* **A-Anchored (PopQA):** (Dashed Brown) Remains relatively stable around 0 throughout all layers.
* **Q-Anchored (TriviaQA):** (Dotted Green) Starts at approximately 0 and decreases to approximately -65 by layer 30, then fluctuates between -50 and -70 until layer 80.
* **A-Anchored (TriviaQA):** (Dashed-Dotted Light Brown) Remains relatively stable around 0 throughout all layers.
* **Q-Anchored (HotpotQA):** (Dashed-Dotted Purple) Starts at approximately 0 and decreases to approximately -70 by layer 30, then fluctuates between -50 and -70 until layer 80.
* **A-Anchored (HotpotQA):** (Dotted Light Brown) Remains relatively stable around 0 throughout all layers.
* **Q-Anchored (NQ):** (Dashed Purple) Starts at approximately 0 and decreases to approximately -60 by layer 30, then fluctuates between -50 and -70 until layer 80.
* **A-Anchored (NQ):** (Dotted Light Gray) Remains relatively stable around 0 throughout all layers.
### Key Observations
* For both models, the "Q-Anchored" series (PopQA, TriviaQA, HotpotQA, and NQ) show a significant decrease in ΔP as the layer number increases, indicating a change in probability when anchoring with the question.
* The "A-Anchored" series (PopQA, TriviaQA, HotpotQA, and NQ) remain relatively stable around 0 for both models, suggesting that anchoring with the answer does not significantly affect the probability.
* The Llama-3-70B model shows more fluctuation in the "Q-Anchored" series after layer 30 compared to the Llama-3-8B model.
### Interpretation
The data suggests that anchoring the question-answering process with the question itself ("Q-Anchored") leads to a substantial change in probability as the model processes deeper layers. This could indicate that the model is refining its understanding or focus as it progresses through the layers. In contrast, anchoring with the answer ("A-Anchored") does not significantly alter the probability, possibly because the answer provides a fixed reference point.
The fluctuations observed in the Llama-3-70B model after layer 30 for the "Q-Anchored" series might indicate that the larger model continues to adjust its understanding or confidence even in later layers, whereas the smaller Llama-3-8B model stabilizes earlier. This could be due to the larger model's greater capacity to process and refine information.
The consistent behavior of the "A-Anchored" series suggests that providing the answer upfront stabilizes the model's probability assessment, regardless of the layer. This could be useful in applications where a consistent and reliable probability score is desired.