## Grouped Bar Chart: Model Accuracy Comparison (Original vs. Fine-tuned)
### Overview
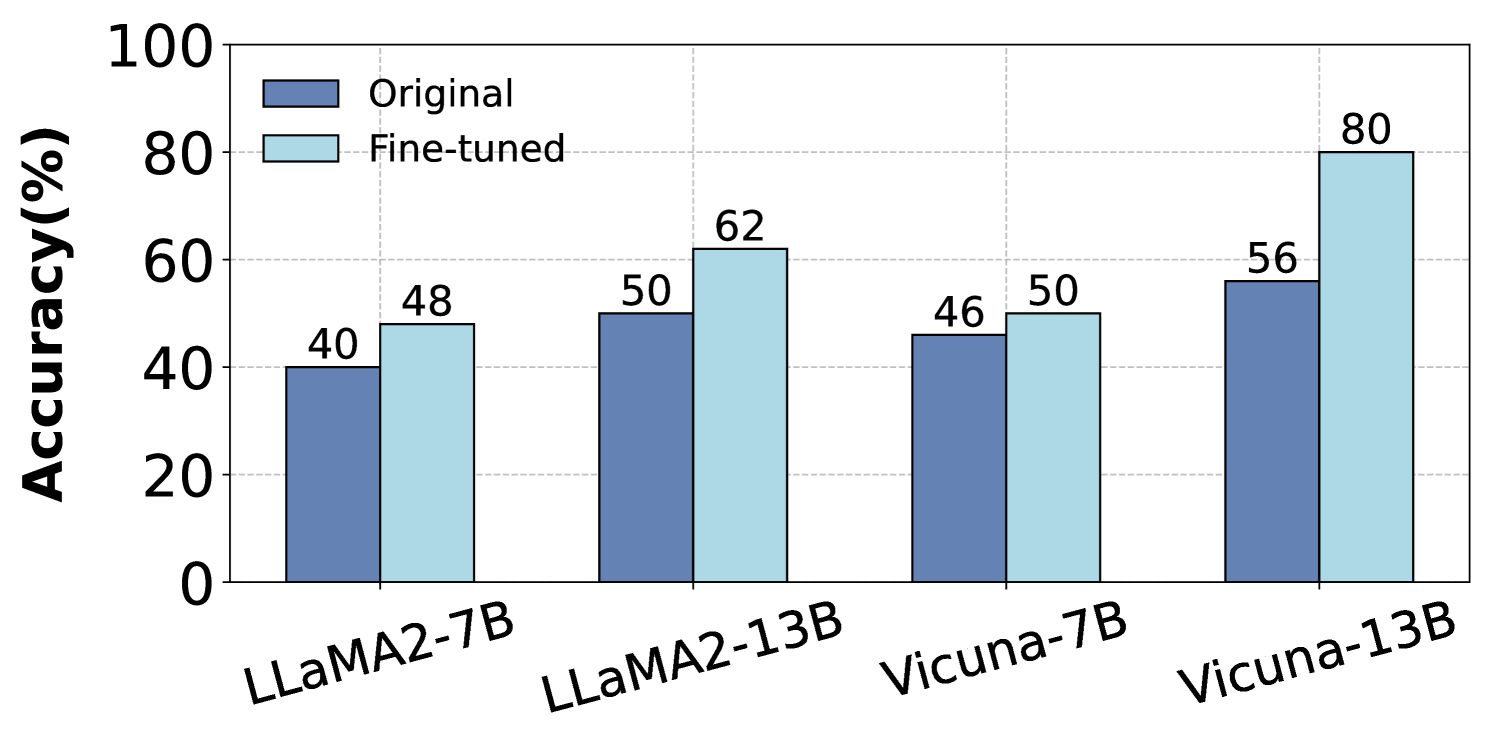
The image displays a grouped bar chart comparing the accuracy percentages of four different large language models in their "Original" and "Fine-tuned" states. The chart demonstrates the performance improvement achieved through fine-tuning for each model variant.
### Components/Axes
* **Chart Type:** Grouped Bar Chart.
* **Y-Axis:**
* **Label:** "Accuracy(%)"
* **Scale:** Linear scale from 0 to 100.
* **Major Tick Marks:** 0, 20, 40, 60, 80, 100.
* **X-Axis:**
* **Categories (Models):** Four distinct models are listed from left to right:
1. LLaMA2-7B
2. LLaMA2-13B
3. Vicuna-7B
4. Vicuna-13B
* **Legend:**
* **Position:** Top-left corner of the chart area.
* **Items:**
* **Dark Blue Square:** Labeled "Original"
* **Light Blue Square:** Labeled "Fine-tuned"
* **Data Labels:** The exact accuracy percentage is printed directly above each bar.
### Detailed Analysis
The chart presents paired data for each model. The left bar (dark blue) represents the "Original" model's accuracy, and the right bar (light blue) represents the "Fine-tuned" model's accuracy.
| Model (X-Axis Category) | Original Accuracy (%) | Fine-tuned Accuracy (%) | Absolute Improvement (Fine-tuned - Original) |
| :--- | :--- | :--- | :--- |
| **LLaMA2-7B** | 40 | 48 | +8 |
| **LLaMA2-13B** | 50 | 62 | +12 |
| **Vicuna-7B** | 46 | 50 | +4 |
| **Vicuna-13B** | 56 | 80 | +24 |
**Trend Verification:**
* For every model pair, the light blue "Fine-tuned" bar is taller than the dark blue "Original" bar, indicating a consistent positive trend where fine-tuning improves accuracy.
* The magnitude of improvement varies significantly between models.
### Key Observations
1. **Universal Improvement:** All four models show higher accuracy after fine-tuning.
2. **Largest Gain:** The **Vicuna-13B** model exhibits the most substantial improvement, with accuracy increasing by 24 percentage points (from 56% to 80%).
3. **Smallest Gain:** The **Vicuna-7B** model shows the smallest improvement, with only a 4 percentage point increase (from 46% to 50%).
4. **Model Size Correlation:** Within each model family (LLaMA2 and Vicuna), the larger 13B parameter model achieves a greater absolute improvement from fine-tuning than its 7B counterpart.
5. **Final Performance:** After fine-tuning, **Vicuna-13B** achieves the highest overall accuracy (80%), while **LLaMA2-7B** has the lowest (48%).
### Interpretation
The data strongly suggests that the fine-tuning process applied in this context is effective for enhancing the accuracy of the tested language models. The relationship is not uniform, however.
The significant variance in improvement (from +4% to +24%) indicates that the efficacy of fine-tuning is highly dependent on the specific base model. The pattern where larger models (13B) benefit more than smaller ones (7B) could imply that larger models have a greater capacity to absorb and utilize the specialized knowledge imparted during fine-tuning.
The most striking result is the performance of **Vicuna-13B**. Its post-fine-tuning accuracy of 80% is not only the highest but also represents a transformative leap from its original state. This could suggest that the fine-tuning dataset or method was particularly well-aligned with the capabilities or pre-training data of the Vicuna-13B model, or that this model had a higher latent potential for the specific task being measured. Conversely, the minimal gain for Vicuna-7B might indicate a performance ceiling for that model size on this task, or a mismatch with the fine-tuning approach.
In summary, the chart provides clear evidence that fine-tuning boosts accuracy, but the degree of benefit is a critical variable that depends on the model's architecture and scale.