## Bar Chart: Project CodeNet dataset
### Overview
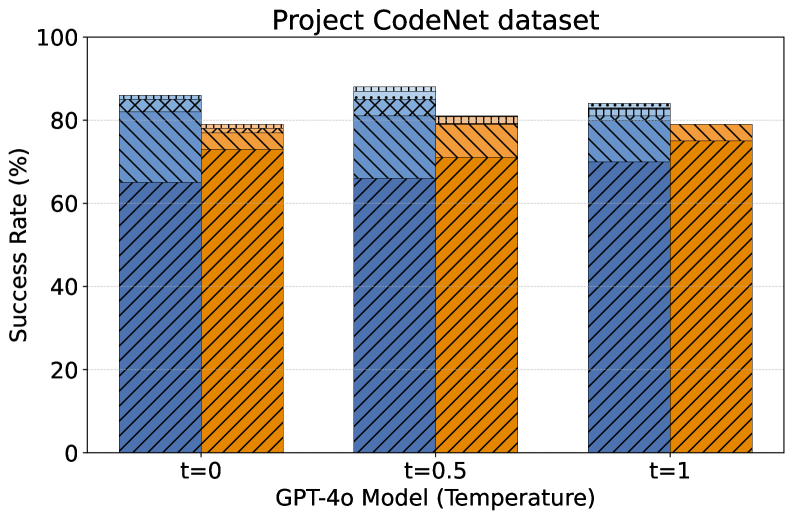
The chart visualizes the success rate distribution across three GPT-4o model temperature settings (t=0, t=0.5, t=1) using stacked bars. Each bar is divided into three color-coded sections representing different success rate components.
### Components/Axes
- **X-axis**: Labeled "GPT-4o Model (Temperature)" with categories t=0, t=0.5, t=1
- **Y-axis**: Labeled "Success Rate (%)" with a scale from 0 to 100
- **Legend**: Located at the top-right corner with three color-coded categories:
- Blue (striped pattern)
- Orange (striped pattern)
- Gray (solid pattern)
- **Bar Structure**: Each temperature group contains three vertically stacked sections corresponding to the legend colors
### Detailed Analysis
1. **t=0**:
- Blue section: ~65% (bottom)
- Orange section: ~15% (middle)
- Gray section: ~5% (top)
- Total success rate: ~85%
2. **t=0.5**:
- Blue section: ~68% (bottom)
- Orange section: ~12% (middle)
- Gray section: ~7% (top)
- Total success rate: ~87%
3. **t=1**:
- Blue section: ~70% (bottom)
- Orange section: ~10% (middle)
- Gray section: ~8% (top)
- Total success rate: ~88%
### Key Observations
- Blue section (likely correct predictions) increases with temperature
- Orange section (likely incorrect predictions) decreases with temperature
- Gray section (possibly errors or neutral outcomes) shows slight increase with temperature
- Total success rate improves marginally from t=0 (85%) to t=1 (88%)
### Interpretation
The data suggests that higher temperature settings in the GPT-4o model correlate with improved overall success rates, primarily driven by increased correct predictions (blue) and reduced incorrect ones (orange). The slight rise in the gray section with temperature might indicate a trade-off where increased model creativity (temperature) improves some outcomes but introduces minor drawbacks. The consistent improvement across all temperature settings implies that the model's performance benefits from higher temperature configurations within this dataset.