# Technical Data Extraction: RIXS Spectroscopy Analysis
This document provides a comprehensive extraction of data and technical components from the provided scientific figure, which compares experimental Resonant Inelastic X-ray Scattering (RIXS) data with theoretical simulations.
## 1. Image Overview and Layout
The image is a multi-panel scientific plot consisting of five distinct sub-figures labeled (a) through (e).
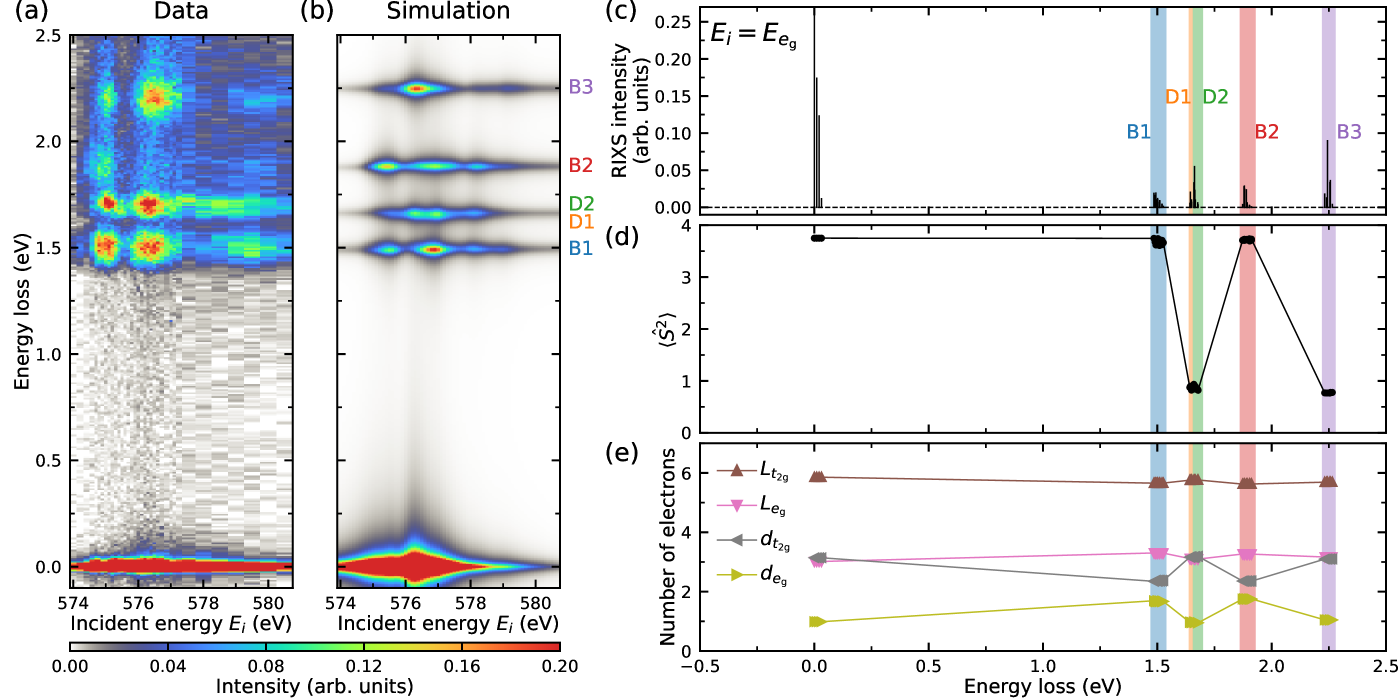
- **Panels (a) and (b):** 2D Heatmaps showing Intensity as a function of Incident Energy ($E_i$) and Energy Loss.
- **Panels (c), (d), and (e):** 1D Line and Scatter plots aligned vertically by a common X-axis (Energy loss).
---
## 2. Component Analysis
### Panel (a): Experimental Data (Heatmap)
* **Title:** Data
* **Y-axis:** Energy loss (eV). Range: 0.0 to 2.5. Markers every 0.5 units.
* **X-axis:** Incident energy $E_i$ (eV). Range: 574 to 581. Markers at 574, 576, 578, 580.
* **Color Scale (Footer):** Intensity (arb. units). Range: 0.00 (Black/Grey) to 0.20 (Red).
* **Key Features:**
* A strong elastic peak at Energy loss = 0 eV, centered around $E_i \approx 576.5$ eV.
* Four distinct inelastic features (horizontal bands) appearing between 1.5 eV and 2.3 eV energy loss.
* The features are most intense when the incident energy is tuned to the resonance near 576.5 eV.
### Panel (b): Theoretical Simulation (Heatmap)
* **Title:** Simulation
* **Y-axis:** Shared with Panel (a).
* **X-axis:** Shared with Panel (a).
* **Labels (Right side):** Four specific bands are identified with colored text:
* **B1** (Blue): Energy loss $\approx 1.5$ eV.
* **D1** (Orange): Energy loss $\approx 1.65$ eV.
* **D2** (Green): Energy loss $\approx 1.7$ eV.
* **B2** (Red): Energy loss $\approx 1.9$ eV.
* **B3** (Purple): Energy loss $\approx 2.25$ eV.
* **Trend:** The simulation closely matches the experimental data in panel (a), showing discrete horizontal excitations at specific energy losses.
### Panel (c): RIXS Intensity Spectrum
* **Y-axis:** RIXS intensity (arb. units). Range: 0.00 to 0.25.
* **X-axis:** Energy loss (eV). Range: -0.5 to 2.5.
* **Annotation:** $E_i = E_{e_g}$ (Top left).
* **Data Description:** A line plot showing sharp peaks.
* Elastic peak at 0 eV (highest intensity).
* Four vertical shaded regions correspond to the labels in Panel (b):
* **Blue (B1):** Peak at ~1.5 eV.
* **Orange/Green (D1/D2):** Peaks at ~1.65-1.7 eV.
* **Red (B2):** Peak at ~1.9 eV.
* **Purple (B3):** Peak at ~2.25 eV.
### Panel (d): Spin Expectation Value $\langle \hat{S}^2 \rangle$
* **Y-axis:** $\langle \hat{S}^2 \rangle$. Range: 0 to 4.
* **X-axis:** Energy loss (eV).
* **Trend Verification:**
* The value starts at approximately **3.75** for the ground state (0 eV) and the B1 excitation.
* There is a sharp drop to approximately **0.8 - 1.0** in the D1/D2 region (Green/Orange shading).
* The value returns to **3.75** for the B2 excitation (Red shading).
* The value drops again to approximately **0.8** for the B3 excitation (Purple shading).
### Panel (e): Electronic Configuration (Number of Electrons)
* **Y-axis:** Number of electrons. Range: 0 to 6.
* **X-axis:** Energy loss (eV).
* **Legend:**
* **Brown Up-Triangle ($\triangle$):** $L_{t_{2g}}$
* **Pink Down-Triangle ($\nabla$):** $L_{e_g}$
* **Grey Right-Triangle ($\rhd$):** $d_{t_{2g}}$
* **Yellow-Green Left-Triangle ($\lhd$):** $d_{e_g}$
* **Data Trends:**
* **$L_{t_{2g}}$ (Brown):** Remains nearly constant at ~5.8 electrons across all energy losses.
* **$L_{e_g}$ (Pink):** Remains nearly constant at ~3.2 electrons.
* **$d_{t_{2g}}$ (Grey):** Starts at ~3.1. It shows a significant dip to ~2.4 in the D1/D2 and B2 regions, returning to ~3.1 at B3.
* **$d_{e_g}$ (Yellow-Green):** Starts at ~1.0. It shows an inverse relationship to $d_{t_{2g}}$, peaking at ~1.8 in the B2 region and dropping back to ~1.0 at B3.
---
## 3. Summary of Key Data Points (Cross-Referenced)
| Feature Label | Color Code | Energy Loss (eV) | $\langle \hat{S}^2 \rangle$ | Primary Change in (e) |
| :--- | :--- | :--- | :--- | :--- |
| **Elastic** | N/A | 0.0 | ~3.75 | Baseline |
| **B1** | Blue | ~1.5 | ~3.75 | Minimal change |
| **D1 / D2** | Orange/Green | ~1.65 - 1.7 | **~0.9 (Drop)** | $d_{t_{2g}}$ decrease / $d_{e_g}$ increase |
| **B2** | Red | ~1.9 | ~3.75 | $d_{t_{2g}}$ decrease / $d_{e_g}$ increase |
| **B3** | Purple | ~2.25 | **~0.8 (Drop)** | Return to baseline $d$ counts |
## 4. Language Declaration
The text in this image is entirely in **English**. No other languages are present.