## Heatmap Series: Attention Head Specialization Across Model Layers
### Overview
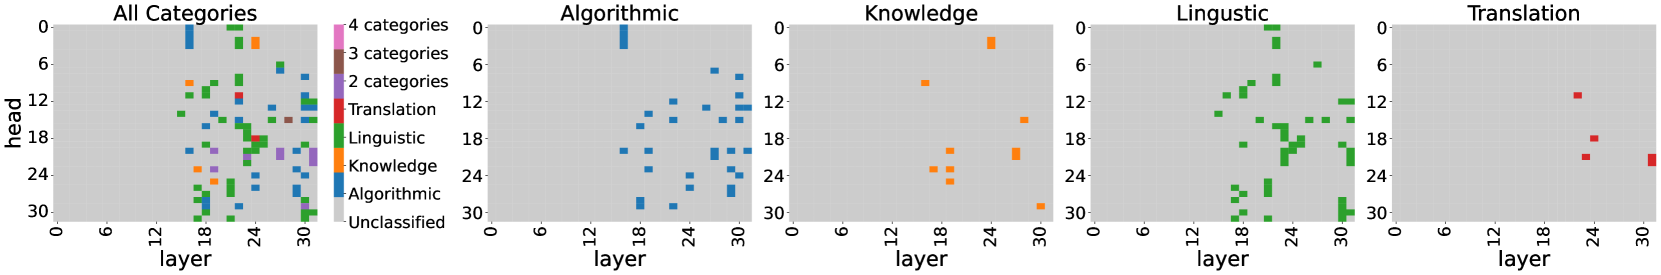
The image displays a series of five horizontally arranged heatmaps that visualize the classification of attention heads within a neural network model (likely a transformer) across its layers. Each heatmap plots "head" index (y-axis) against "layer" index (x-axis), with colored squares indicating heads assigned to specific functional categories. The first plot aggregates all classifications, while the subsequent four plots isolate individual categories.
### Components/Axes
* **Common Axes (All Plots):**
* **X-axis:** Labeled "layer". Scale ranges from 0 to 30, with major tick marks at 0, 6, 12, 18, 24, 30.
* **Y-axis:** Labeled "head". Scale ranges from 0 to 30, with major tick marks at 0, 6, 12, 18, 24, 30.
* **Legend (Positioned to the left of the first plot):**
* **4 categories:** Pink square
* **3 categories:** Brown square
* **2 categories:** Purple square
* **Translation:** Red square
* **Linguistic:** Green square
* **Knowledge:** Orange square
* **Algorithmic:** Blue square
* **Unclassified:** Gray square (This also serves as the background color for all plots).
* **Plot Titles (Positioned above each heatmap):**
1. All Categories
2. Algorithmic
3. Knowledge
4. Linguistic
5. Translation
### Detailed Analysis
**1. All Categories Plot:**
This plot shows heads classified into one or more categories. The distribution is densest in the later layers (approximately layers 18-30).
* **Multi-Category Heads:** Pink (4 categories) and brown (3 categories) squares are scattered, primarily between layers 18-24 and heads 12-24. Purple (2 categories) squares are also present in this region.
* **Single-Category Heads:** The plot is a composite of the colors from the subsequent four plots, showing the spatial overlap and segregation of different functional specializations.
**2. Algorithmic Plot (Blue):**
* **Trend:** Blue squares are distributed across layers ~18-30 and heads 0-30, with a notable concentration in the mid-to-lower head range (heads 12-30) of layers 24-30.
* **Data Points (Approximate):** Clusters are visible around (layer 24, head 18), (layer 27, head 24), and (layer 30, head 6). The pattern is somewhat scattered but avoids the very top rows (heads 0-6) in earlier layers.
**3. Knowledge Plot (Orange):**
* **Trend:** Orange squares are the most sparsely distributed. They appear almost exclusively in layers 18-30 and are scattered across the head range.
* **Data Points (Approximate):** Isolated points can be seen near (layer 18, head 9), (layer 21, head 21), (layer 24, head 24), and (layer 30, head 27). There is no dense clustering.
**4. Linguistic Plot (Green):**
* **Trend:** Green squares show a very dense and widespread distribution across layers 18-30 and heads 0-30. This appears to be the most prevalent single-category classification.
* **Data Points (Approximate):** Heavy clustering is evident, particularly in layers 21-27 across almost all head indices. A dense vertical band is visible around layer 24.
**5. Translation Plot (Red):**
* **Trend:** Red squares are the least frequent and are confined to the highest layers (approximately 24-30) and mid-to-lower head indices (heads 12-30).
* **Data Points (Approximate):** A small cluster is present around (layer 27, head 18) and (layer 30, head 21). Only a handful of red squares are visible in total.
### Key Observations
1. **Layer Specialization:** All functional specializations (Algorithmic, Knowledge, Linguistic, Translation) are almost entirely absent in the first 18 layers. Specialization emerges and intensifies in the final third of the network (layers 18-30).
2. **Category Prevalence:** The "Linguistic" category (green) is the most dominant and widespread single function in the later layers. "Translation" (red) is the most specialized and limited in scope.
3. **Multi-Function Heads:** The presence of pink, brown, and purple squares in the "All Categories" plot indicates that a subset of heads in layers 18-24 are involved in multiple functional categories simultaneously.
4. **Spatial Segregation:** While there is overlap, different categories show tendencies for different regions. For example, "Translation" heads are in higher layers and specific head ranges, while "Algorithmic" heads are more broadly distributed.
### Interpretation
This visualization provides a Peircean investigation into the internal functional organization of a large language model. It suggests a hierarchical processing structure where:
* **Early Layers (0-18):** Likely perform general, low-level processing not tied to these specific high-level task categories (hence "Unclassified").
* **Later Layers (18-30):** Exhibit functional specialization. The model appears to develop dedicated circuits or groups of attention heads for distinct capabilities: understanding and generating language (Linguistic), performing reasoning or calculations (Algorithmic), accessing factual information (Knowledge), and converting between languages (Translation).
* **The Coexistence of Multi-Category Heads** in the transition zone (layers 18-24) may represent integrative hubs where different types of information are combined before being processed by more specialized heads in the final layers.
* **The dominance of Linguistic heads** aligns with the core function of a language model, while the scarcity of Translation heads suggests this capability might be handled by a very specific, localized set of parameters or is a more emergent property.
The data demonstrates that model capabilities are not uniformly distributed but are spatially organized within the network's architecture, with clear progression from general to specialized processing along the layer axis.