## Line Chart: I-Don't-Know Rate vs. Layer for Mistral-7B-v0.1 and Mistral-7B-v0.3
### Overview
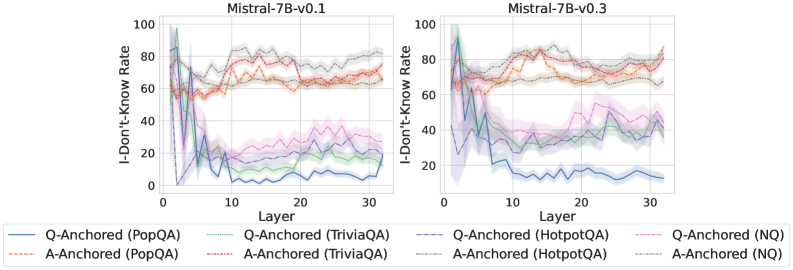
The image presents two line charts comparing the "I-Don't-Know Rate" across different layers of the Mistral-7B model, specifically versions v0.1 and v0.3. Each chart displays six data series, representing different question-answering datasets (PopQA, TriviaQA, HotpotQA, and NQ) anchored either to the question (Q-Anchored) or the answer (A-Anchored). The x-axis represents the layer number, ranging from 0 to 30, while the y-axis represents the "I-Don't-Know Rate" from 0 to 100.
### Components/Axes
* **Titles:**
* Left Chart: Mistral-7B-v0.1
* Right Chart: Mistral-7B-v0.3
* **X-Axis:**
* Label: Layer
* Scale: 0 to 30, with tick marks at intervals of 10.
* **Y-Axis:**
* Label: I-Don't-Know Rate
* Scale: 0 to 100, with tick marks at intervals of 20.
* **Legend:** Located at the bottom of the image.
* Q-Anchored (PopQA): Solid Blue Line
* A-Anchored (PopQA): Dashed Brown Line
* Q-Anchored (TriviaQA): Dotted Green Line
* A-Anchored (TriviaQA): Dash-Dotted Pink Line
* Q-Anchored (HotpotQA): Dash-Dot-Dotted Gray Line
* A-Anchored (HotpotQA): Solid Red Line
* Q-Anchored (NQ): Dashed-Dotted Purple Line
* A-Anchored (NQ): Dotted-Dashed Gray Line
### Detailed Analysis
#### Mistral-7B-v0.1 (Left Chart)
* **Q-Anchored (PopQA):** (Solid Blue Line) Starts high (around 60-80) and rapidly decreases to around 10-20 by layer 10, then remains relatively stable around that level.
* Layer 0: ~60
* Layer 10: ~15
* Layer 30: ~10
* **A-Anchored (PopQA):** (Dashed Brown Line) Starts around 60, increases to 80 by layer 10, and then fluctuates between 70 and 80.
* Layer 0: ~60
* Layer 10: ~80
* Layer 30: ~70
* **Q-Anchored (TriviaQA):** (Dotted Green Line) Starts high (around 80), decreases to around 10-20 by layer 10, and then remains relatively stable around that level.
* Layer 0: ~80
* Layer 10: ~10
* Layer 30: ~15
* **A-Anchored (TriviaQA):** (Dash-Dotted Pink Line) Starts around 60, decreases to around 20-40 by layer 10, and then remains relatively stable around that level.
* Layer 0: ~60
* Layer 10: ~30
* Layer 30: ~30
* **Q-Anchored (HotpotQA):** (Dash-Dot-Dotted Gray Line) Starts around 80, increases to 90 by layer 5, and then fluctuates between 70 and 90.
* Layer 0: ~80
* Layer 10: ~80
* Layer 30: ~80
* **A-Anchored (HotpotQA):** (Solid Red Line) Starts around 60, increases to 70 by layer 10, and then fluctuates between 60 and 80.
* Layer 0: ~60
* Layer 10: ~70
* Layer 30: ~70
* **Q-Anchored (NQ):** (Dashed-Dotted Purple Line) Starts around 60, decreases to around 20-40 by layer 10, and then remains relatively stable around that level.
* Layer 0: ~60
* Layer 10: ~30
* Layer 30: ~30
* **A-Anchored (NQ):** (Dotted-Dashed Gray Line) Starts around 80, increases to 90 by layer 5, and then fluctuates between 70 and 90.
* Layer 0: ~80
* Layer 10: ~80
* Layer 30: ~80
#### Mistral-7B-v0.3 (Right Chart)
* **Q-Anchored (PopQA):** (Solid Blue Line) Starts high (around 80-100) and rapidly decreases to around 10-20 by layer 10, then remains relatively stable around that level.
* Layer 0: ~80
* Layer 10: ~15
* Layer 30: ~15
* **A-Anchored (PopQA):** (Dashed Brown Line) Starts around 60, increases to 80 by layer 10, and then fluctuates between 70 and 90.
* Layer 0: ~60
* Layer 10: ~80
* Layer 30: ~80
* **Q-Anchored (TriviaQA):** (Dotted Green Line) Starts high (around 80), decreases to around 10-20 by layer 10, and then remains relatively stable around that level.
* Layer 0: ~80
* Layer 10: ~15
* Layer 30: ~20
* **A-Anchored (TriviaQA):** (Dash-Dotted Pink Line) Starts around 60, decreases to around 20-40 by layer 10, and then remains relatively stable around that level.
* Layer 0: ~60
* Layer 10: ~30
* Layer 30: ~30
* **Q-Anchored (HotpotQA):** (Dash-Dot-Dotted Gray Line) Starts around 80, increases to 90 by layer 5, and then fluctuates between 70 and 90.
* Layer 0: ~80
* Layer 10: ~80
* Layer 30: ~80
* **A-Anchored (HotpotQA):** (Solid Red Line) Starts around 60, increases to 80 by layer 10, and then fluctuates between 70 and 90.
* Layer 0: ~60
* Layer 10: ~80
* Layer 30: ~80
* **Q-Anchored (NQ):** (Dashed-Dotted Purple Line) Starts around 60, decreases to around 20-40 by layer 10, and then remains relatively stable around that level.
* Layer 0: ~60
* Layer 10: ~30
* Layer 30: ~30
* **A-Anchored (NQ):** (Dotted-Dashed Gray Line) Starts around 80, increases to 90 by layer 5, and then fluctuates between 70 and 90.
* Layer 0: ~80
* Layer 10: ~80
* Layer 30: ~80
### Key Observations
* **Q-Anchored (PopQA) and Q-Anchored (TriviaQA):** Both exhibit a similar trend of a sharp decline in "I-Don't-Know Rate" in the initial layers, followed by stabilization.
* **A-Anchored (PopQA), Q-Anchored (HotpotQA), A-Anchored (HotpotQA), and A-Anchored (NQ):** These series generally maintain a higher "I-Don't-Know Rate" across all layers.
* **Model Version Comparison:** The trends are generally similar between Mistral-7B-v0.1 and Mistral-7B-v0.3, but the v0.3 model seems to have a slightly higher "I-Don't-Know Rate" for some series in the initial layers.
### Interpretation
The charts suggest that the "I-Don't-Know Rate" varies significantly depending on the question-answering dataset and whether the anchoring is done to the question or the answer. The rapid decline in the "I-Don't-Know Rate" for Q-Anchored (PopQA) and Q-Anchored (TriviaQA) in the initial layers indicates that the model quickly learns to answer these types of questions. Conversely, the higher and more stable "I-Don't-Know Rate" for A-Anchored (PopQA), Q-Anchored (HotpotQA), A-Anchored (HotpotQA), and A-Anchored (NQ) suggests that these question types are more challenging for the model, and it struggles to provide confident answers even after processing through multiple layers. The slight differences between v0.1 and v0.3 might indicate minor improvements or changes in the model's behavior, but the overall trends remain consistent.